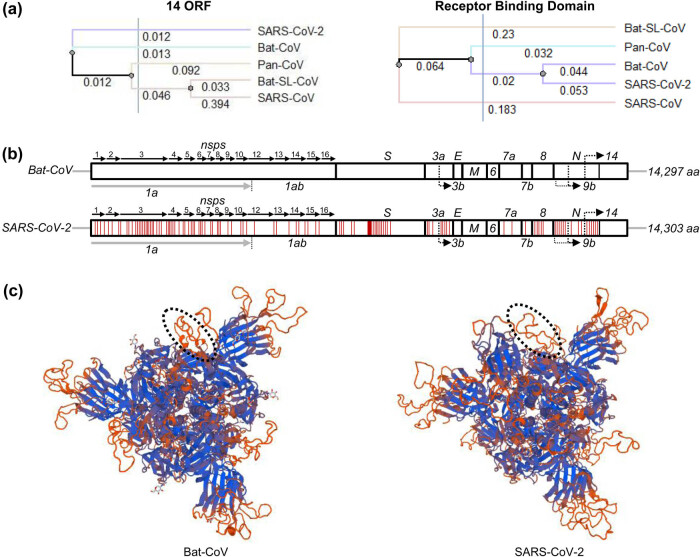
Figure 2.
Comparison of SARS-CoV-2 and Bat-CoVs. (a) The phylogeny of SARS-CoV-2 based on the 14 ORF and receptor-binding domain (RBD) sequences of Bat-CoV, Pan-CoV, Bat-SL-CoV, and SARS-CoV. Phylogenies were estimated by the neighbor-joining method using Unipro UGENE bioinformatics toolkits. (b) Organization of genes in SARS-CoV-2 and Bat-CoVs. The distribution of mutated amino acids in SARS-CoV-2 compare to Bat-CoV are represented with red lines. (c) Homotrimer 3D model of Bat-CoV and SARS-CoV-2 spike protein constructed using the SWISS-MODEL protein homology-modeling server. Circle showing the altered surface structure in the spike region of SARS-CoV-2 for antigen binding.

