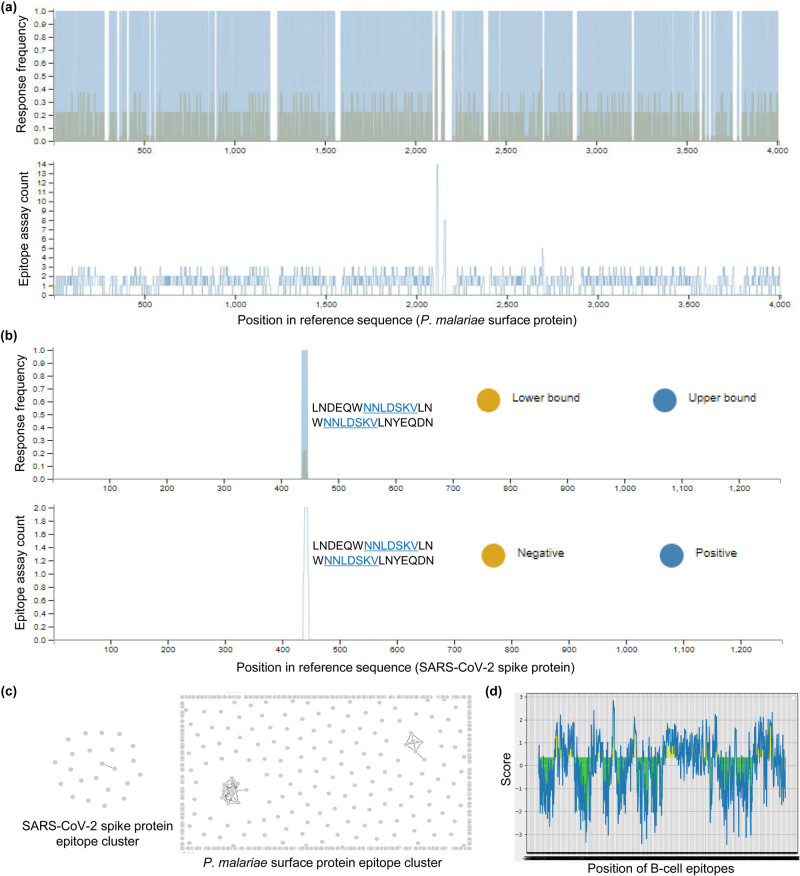
Figure 4.
T cell immunodominant regions based on the conserved surface protein of P. malariae. (a) Specific T cell epitope mapping response frequency score (RF) for each epitope position from P. malariae conserved surface protein. (b) Mapping of T cell epitopes of the conserved surface protein of P. malariae against SARS-CoV-2 spike glycoprotein. (c and d) Cluster analysis of epitopes of SARS-CoV-2 spike glycoprotein and surface protein of P. malariae for identification sequence homology. (d) Mapping of B cell epitopes from a conserved surface protein of P. malariae.

