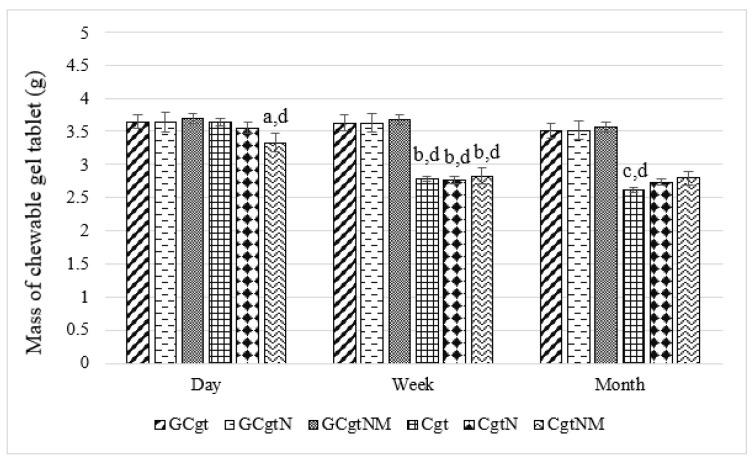
Figure 4.
Mass variation in different chewable gel tablets, n = 10; (a) p < 0.05 versus all samples with glycerol (GCtg, GCtgN, and GCtgNM); (b) p < 0.05 versus relative samples after one day; (c) p < 0.05 versus Cgt sample after one week; and (d) p < 0.05 versus relative samples with glycerol in composition; code meaning is given in “2.6. Chewable Gel Tablets’ Preparation” section.

