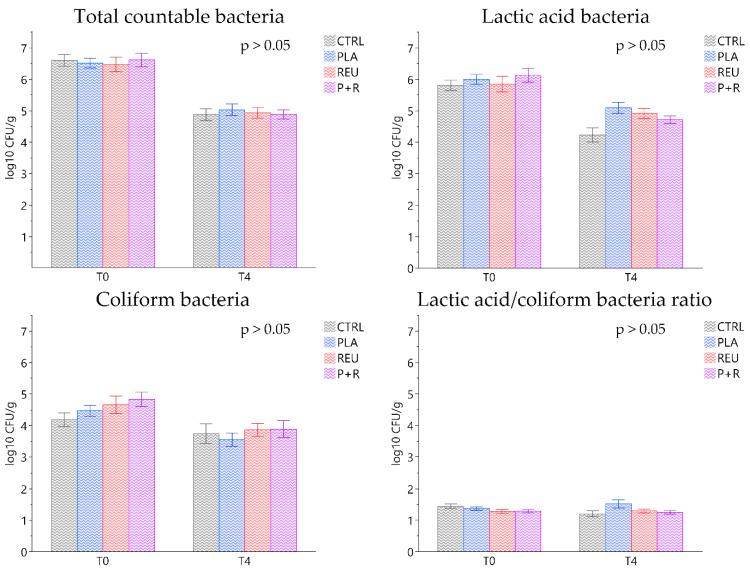
Figure 6.
Faecal colonies of the principal bacterial groups (total countable bacteria, lactic acid bacteria, coliform bacteria and lactic acid/coliform ratio) for the control (CTRL) and treatment groups (PLA, REU and P+R) measured at the beginning (T0) and after 28 days of the trial (T4). Data are expressed as least square means (LSMEANS) and standard errors (SE). CTRL: control group; PLA: treatment group supplemented with 2 × 10⁸ CFU/g of L. plantarum; REU: treatment group supplemented with 2 × 10⁸ CFU/g of L. reuteri; P+R: treatment group supplemented with 2 × 10⁸ CFU/g of L. plantarum and L. reuteri (1:1, w/w).

