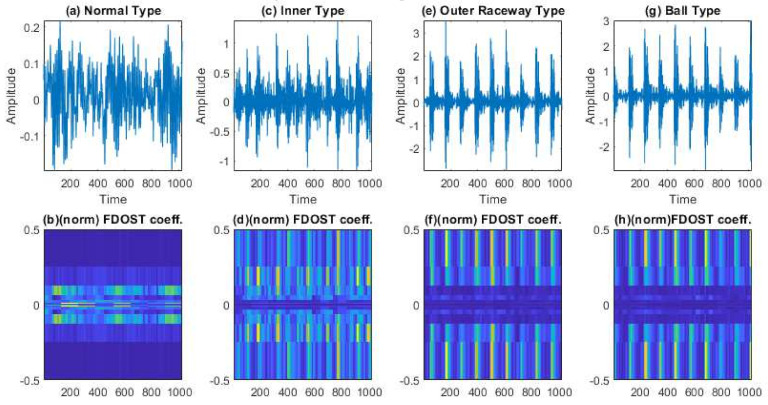
Figure 8.
The visualization of dataset 1 in terms of raw time domain signals and respective 2D FDOST coefficient matrix—(a,b): time domain, and 2D FDOST coefficient of NT, (c,d): time domain, and 2D FDOST coefficient of IRT, (e,f): time domain, and 2D FDOST coefficient of ORT, and (g,h): time domain, and 2D FDOST coefficient of BT.

