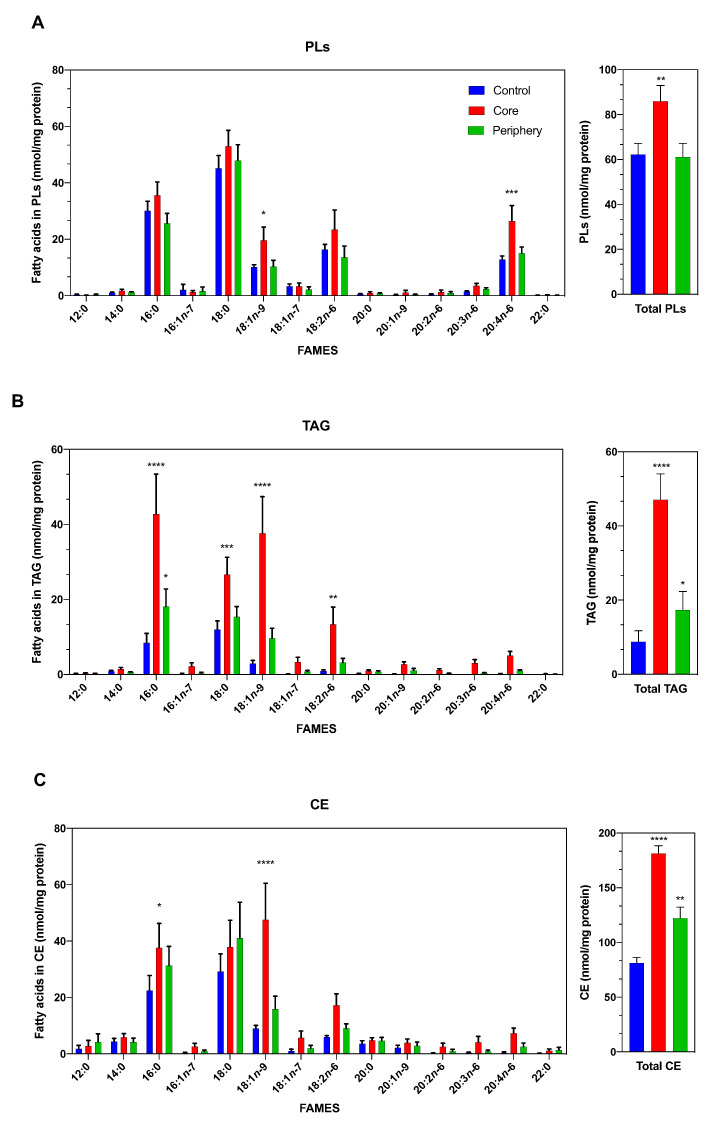
Figure 1.
Lipidomic profile of ccRCC. (A) The profile of major phospholipid fatty acids in healthy distal normal tissue (blue bars) or tumors (core and periphery: red and green, respectively) were determined by GC/MS after converting the fatty acid glyceryl esters into fatty acid methyl esters. (B,C) Profile of fatty acids present in neutral lipids (TAG and CE). Data are expressed as the means ± SEM (n = 12). * p < 0.05, ** p < 0.01, *** p < 0.001 and **** p < 0.0001, significantly different from the control.

