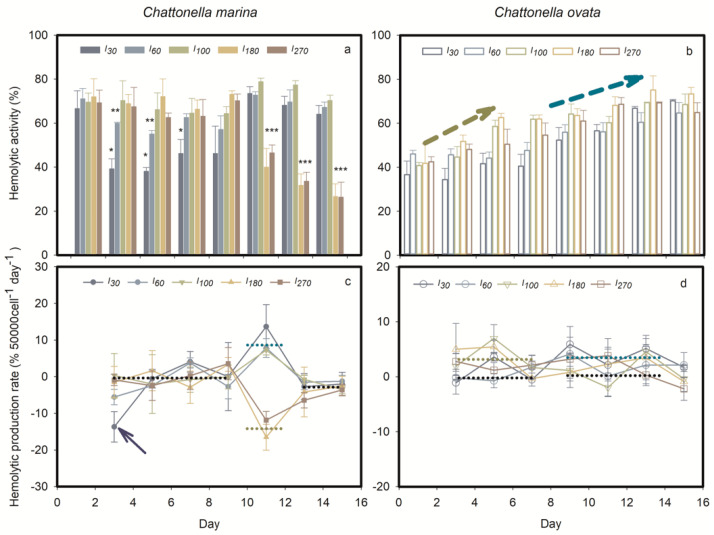
Figure 5.
Time course of mean (± standard deviation) percent hemolytic activity (a,b) and toxin production rate (c,d) of Chattonella marina and C. ovata under different light intensities (I). *, ** and *** indicate the significance of the differences, p < 0.05, p < 0.01 and p < 0.001, respectively. The yellow arrows indicate a significant difference with an average value among five light treatments over 0 to 4 days. The dark blue arrows indicate significant differences among average values of five light treatments over 8 to 14 days.

