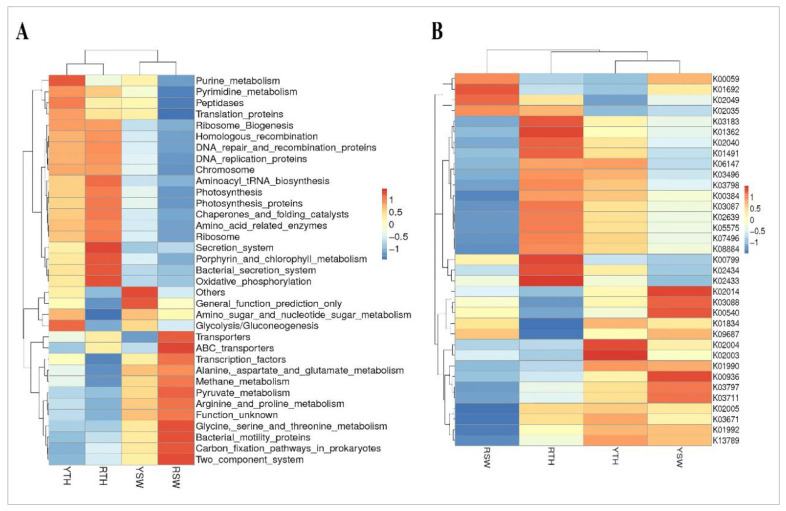
Figure 6.
(A) Heat map display of the hierarchical clustering of the predicted KEGG ortholog (KEGG level 3) gene copy number (log10 transformed) of bacterial microbiota across all samples. (B) Cluster heat map display of KOs based on the predicted gene copy (log10 transformed) of bacterial microbiota across all sample groups. K00059 fabG, K01692 paaF, K02049 ABC.SN.A,K02035 ABC.PE.S, K03183 ubiE, K01362 OVCH, K02040 pstS, K01491 folD, K06147 ABCB-BAC, K03496 parA, K03798 ftsH, K00384 trxB, K03087 rpoS, K02639 petF, K05575 ndhD, K07496 putative transposase, K08884 serine/threonine protein kinase, K00799 GST, K02434 gatB, K02433 gatA, K02014 TC.FEV.OM, K03088 rpoE, K00540 fqr, K01834 PGAM, K09687 Antibiotic transport system, K02004 ABC.CD.P, K02003 ABC.CD.A, K01990 ABC-2.A, K00936 pdtaS, K03797 ctpA, K03711 fur, K02005 ABC.CD.TX, K03671 trxA, K01992 ABC-2.P, K13789 GGPS.

