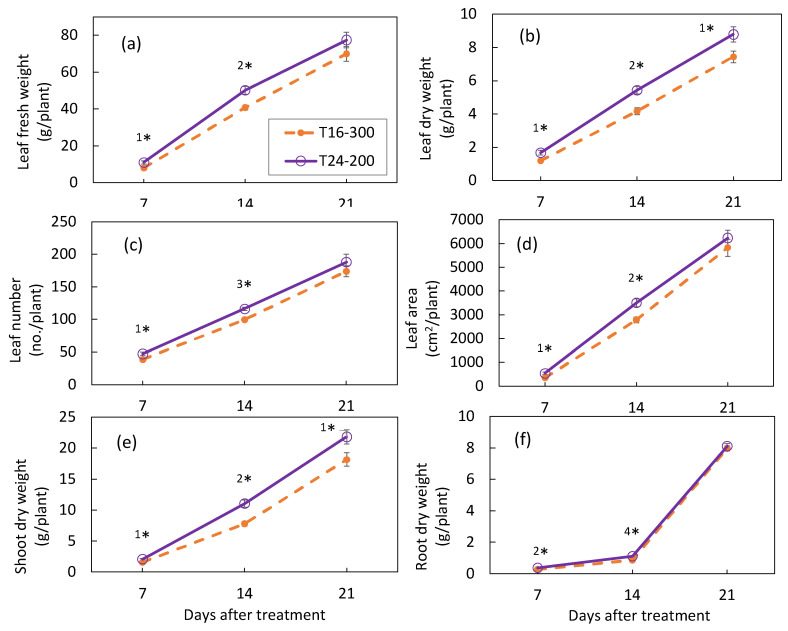
Figure 2.
Leaf fresh (a) and dry weight (b), leaf numbers (c), leaf area (d), shoot dry weight (e), and root dry weight (f) of nasturtium grown under T16-300 and T24-200 at 7, 14, and 21 days after treatment. Values are the means ± SE (n = 6). Asterisks indicate significant differences between the treatments (1*, p < 0.05; 2*, p < 0.01; 3*, p < 0.001, and 4*, p < 0.0001), determined by the t-test. Plant density during the 1st, 2nd, and 3rd weeks was 21.5, 16.7, and 11.1 plants m−2, respectively.

