Figure 7.
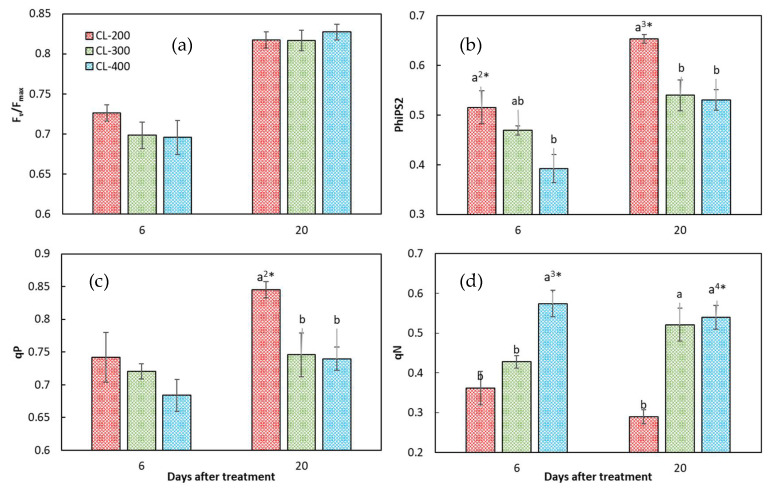
The maximum quantum yield of the PSII primary photochemistry (Fv/Fmax) (a), quantum yield of the PSII electron transport (PhiPS2) (b), and the coefficients of photochemical quenching (qP) (c) and nonphotochemical quenching (qN) (d) of nasturtium grown under CL-200, CL-300, and CL-400 at 6 and 20 days after treatment in Experiment 2. CL-200, CL-300, and CL-400 represent the light period of 24 h per day with a light intensity at 200, 300, and 400 µmol m-2 s−1, respectively. Values are the means ± SE (n = 8). Different alphabet letters indicate significant differences between the treatments, the signs, 2*, 3*, or 4* put after the alphabet ‘a’ at the largest mean for each parameter and each ‘days after treatment’, indicating that the probability of the ANOVA (the multiple mean comparison by Tukey) was p < 0.01, p < 0.001, or p < 1.0 × 10⁻⁴, respectively.

