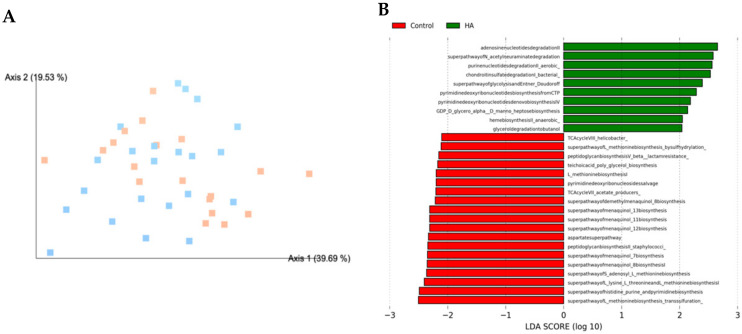
Figure 6.
PICRUSt2 functional prediction. (A) PCoA plot displaying Bray Curtis beta diversity matrix calculations (Control = orange; HA 35 KDa = blue). Percent confidence values for each distance matrix are displayed on the axes in two dimensions. PERMANOVA results: F = 1.80; p = 0.1. (B) Predicted metabolic pathways statistically attributed to the experimental variable. PICRUSt was used to predict the functional potential of microbiomes using 16S rRNA gene sequence data. Red bars represent controls; green bars represent HA 35 KDa-treated pups. HA: hyaluronic acid; PCoA: principal components analysis; LDA = linear discriminant analysis; PICRUSt = Phylogenetic Investigation of Communities by Reconstruction of Unobserved States.

