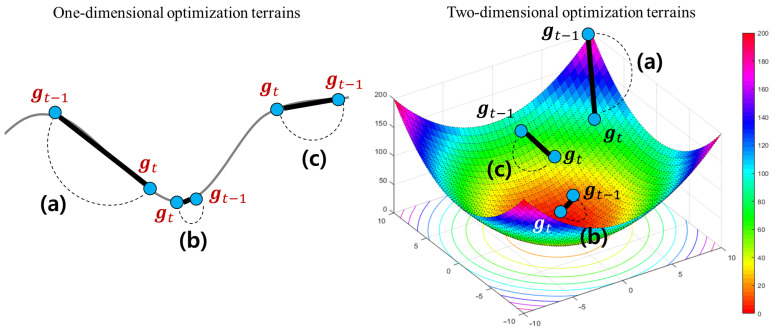
Figure 6.
The examples to show a difference between the current gradient and its previous gradient . The left figure shows that an one-dimensional loss function with several local minimums. The right figure describes a zoomed area around any local (or global) minimum of a two-dimensional loss function. In the two example plots, (a–c) illustrate three cases where the degree of variations between and is large, small, and medium, respectively.

