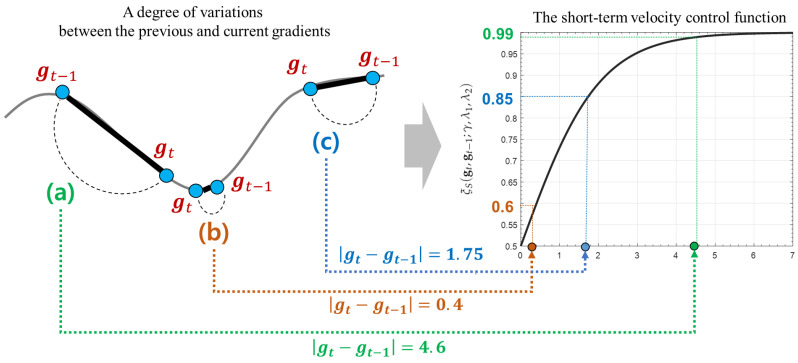
Figure 7.
The principles of the short-term velocity control function. The right graph presents the plot of the short-term velocity control function described in Equation (17). (a) describes an example case that this function returns a value close to 1 as the difference between and becomes large. On the other hands, (b) shows other case that this function returns a value close to 0.5 as their difference becomes small. Finally, (c) illustrates how the short-term velocity control value is computed when a degree of their variation is 1.75. These examples show that this function can control the search velocity adaptively depending on a degree of variation of their previous and current gradients.

