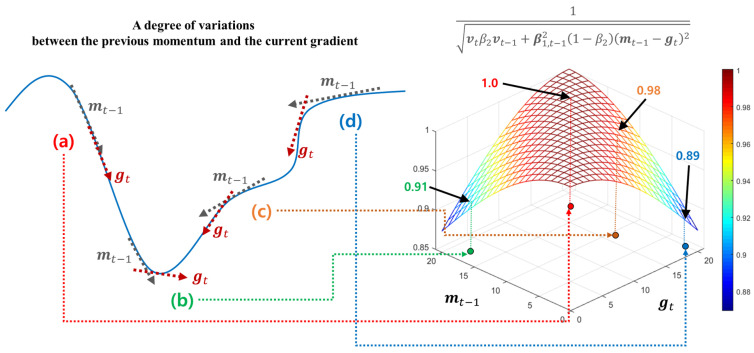
Figure 8.
The principles of the long-term velocity control function. The left examples, i.e., (a–d) show how much the difference between and . The right graph shows a plot of the long-term velocity control function in two-dimensional space. Each arrow from the left to the right figures describes how these differences are mapped to the long-term velocity control function.

