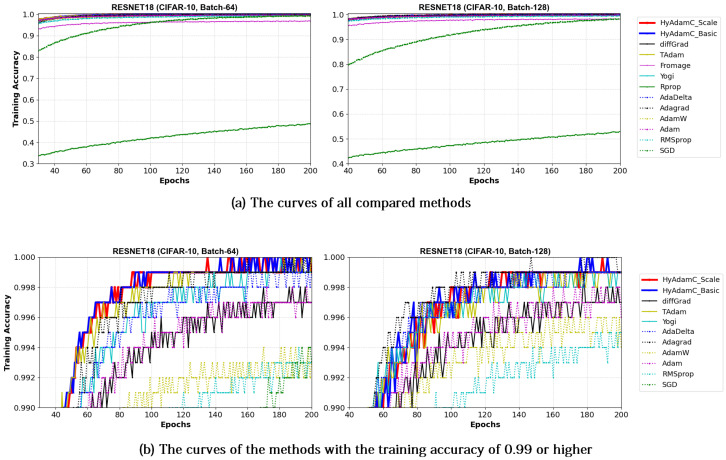
Figure 17.
The training accuracy curves of the ResNet-18 trained by HyAdamC and other optimization methods in the CIFAR-10 image classification tasks. In this figure, (a) shows the training accuracy curves of all compared methods. On the other hand, (b) illustrates the plots in which a range of the y-axis of the plots described in (a) is zoomed into between 0.99 and 1.

