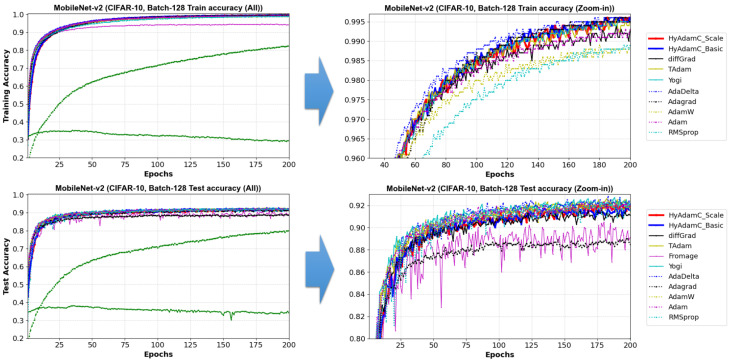
Figure 25.
The training and test accuracy curves of the MobileNet-v2 trained by HyAdamC and other optimization methods in the CIFAR-10 image classification tasks. In this figure, the plots in the left side shows the training and test curves of all compared methods. On the other hand, ones in the right side illustrates the plots in which a range of the y-axis of the left plots is zoomed in.

