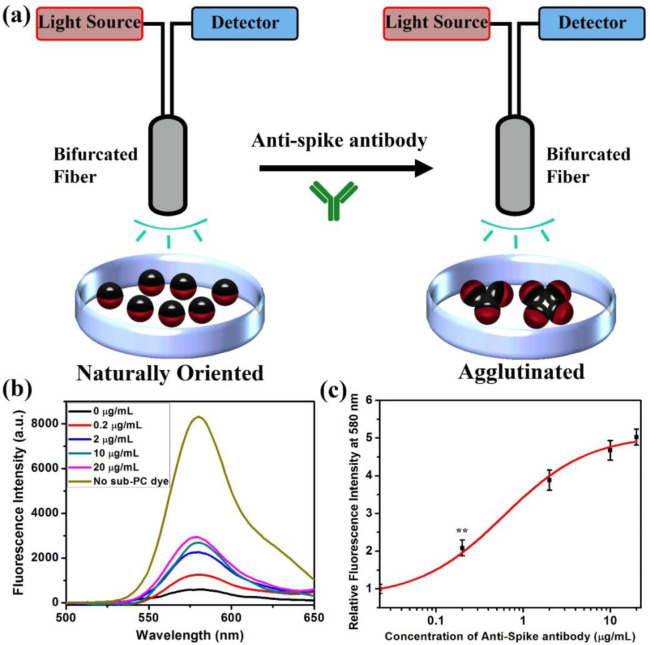
Figure 4.
Quantification of agglutination assay by measuring the fluorescence spectra. (a) Schematic of excitation and detection of fluorescence from the naturally oriented or agglutinated dye containing emulsions. Light is only able to reach the red dye when the droplets are tilted in the agglutinated structure. (b) Fluorescence spectra (λex = 361 nm) of 1:1 mixture of dye containing fully bioconjugated Janus droplets with the addition of anti-SARS-CoV-2 spike antibody at different concentrations. Note that the fluorescence intensity increases with concentration. (c) Correlation of concentration of anti-SARS-CoV-2 spike antibody and relative fluorescence intensity at 580 nm. All error bars are standard deviation calculated from three independent experiments (n = 3), and the asterisks (∗∗) represent statistical significance (**p ≤ 0.01).

