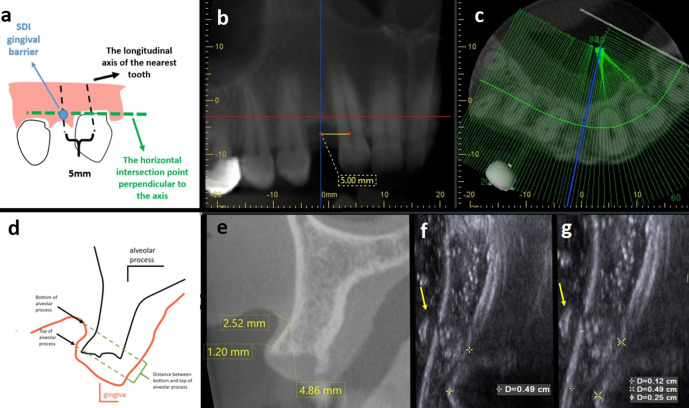
Figure 1.
Gingival soft tissue thickness measurement of the same implant region conducted by CBCT (i-Dixel Software, Morita 3D Accuitomo 170®, J Morita, Kyoto, Japan) and US ACUSON S 2000 (Siemens, Munich, Germany) in mm and cm.) (a) Schematic drawing of reference point determination. Black arrow shows the longitudinal axis of nearest adjacent tooth and 5 mm distance on cemento-enamal junction level; green arrow shows the horizontal intersection point perpendicular to long axis; blue circle and arrow show SDI gingival barrier. (b) Representative panoramic view showing 5 mm distance measurement between longitudinal axis of adjacent tooth; blue line corresponds to selected cross-sectional image. (c) Axial CBCT image: blue line corresponds to selected cross-sectional image. (d) Representative schematic drawing of reference point determination. (e) Representative CBCT image of the drawing shown in (d). Labial/buccal soft tissue thickness measurements were performed perpendicular to alveolar process at two different points; top of the alveolar process and bottom of the alveolar process on CBCT images by using measurement tools in mm. The distance between top of alveolar process and bottom (f) Vertical distance measurement between reference points was found to be 0.49 cm in US image. Hyperechogenic barrier was used as reference point for mesiodistal location of measurement point. Yellow arrow shows hyperechogenic gingival barrier. (g) In US images gingival thickness measurement of top and bottom of alveolar process was 0.12 cm and 0.25 cm, respectively.

