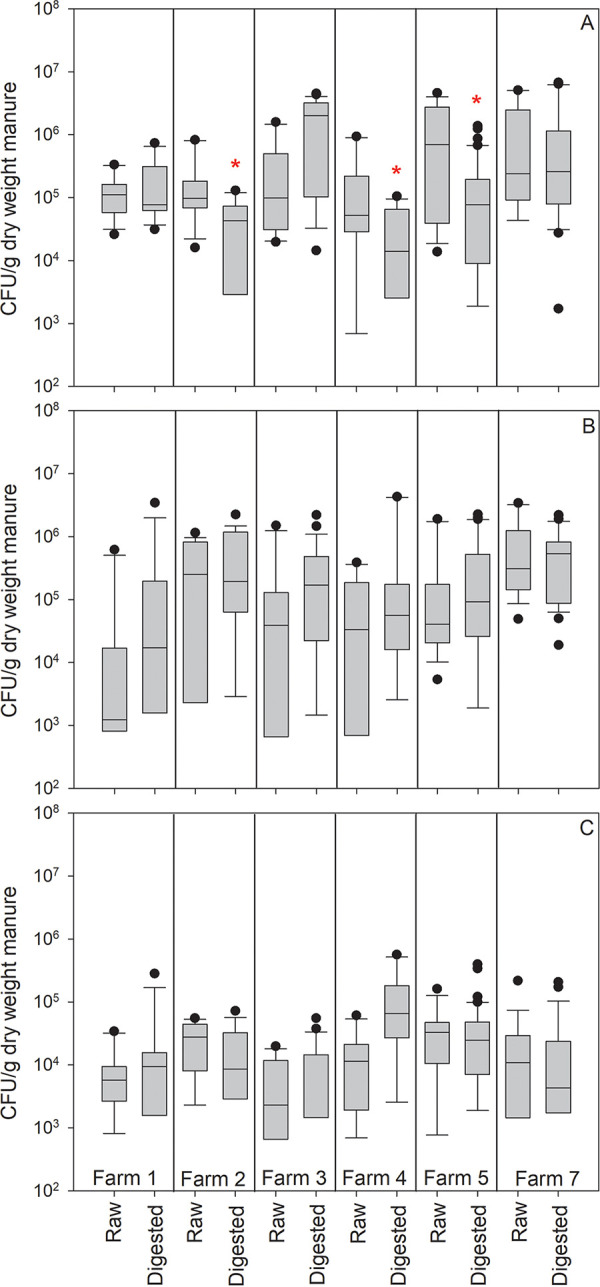
FIG 2.

A comparison of selected Gram-positive viable counts in raw and digested manure across the six participating farms: (A) Enterococcus spp., (B) Staphylococcus spp., and (C) Clostridium perfringens. Box plot description and sample numbers per farm are indicated in Fig. 1. Asterisks indicate a statistically significant difference (Mann-Whitney U test, P < 0.05) between raw manure and digested manure.
