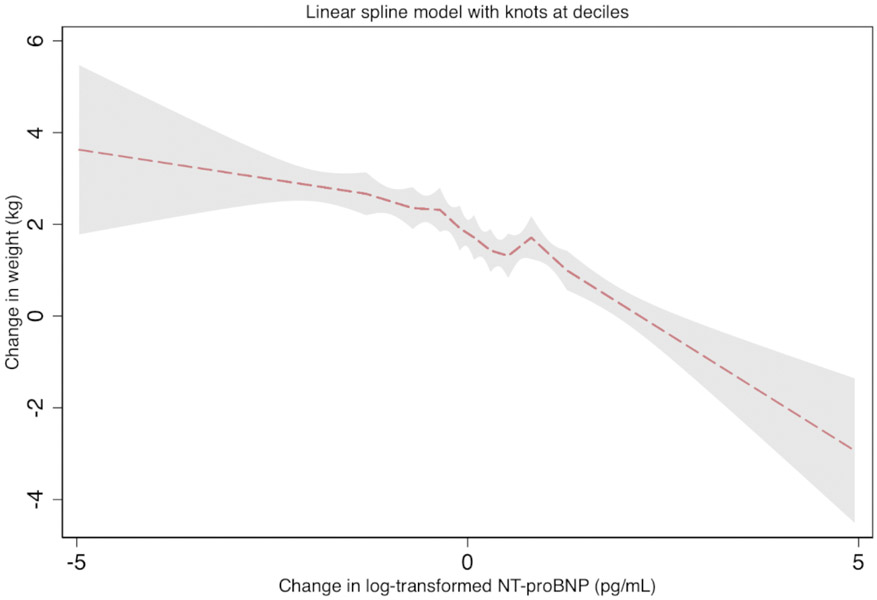
Figure 1. Adjusted six-year change in log-transformed NT-proBNP with change in weight (β coefficient, 95%CI), the Atherosclerosis Risk in Communities (ARIC) Study (1990-1992 to 1996-1998).
The association between weight change as a linear spline with log-transformed change in NT-proBNP. The dashed line is the β coefficient and the shaded region is the 95% confidence interval. Knots are located at deciles of change in log NT-proBNP. This model is adjusted for age, sex, race-center, smoking status, estimated glomerular filtration rate, hypertension, diabetes, heart failure, atherosclerotic cardiovascular disease (coronary heart disease or stroke), total cholesterol, high-density lipoprotein-cholesterol and lipid lowering medication. We found an inverse association between change in weight and change in NT-proBNP level.

