. 2021 Feb 24;3(3):e200159. doi: 10.1148/ryai.2021200159

Figure 2:

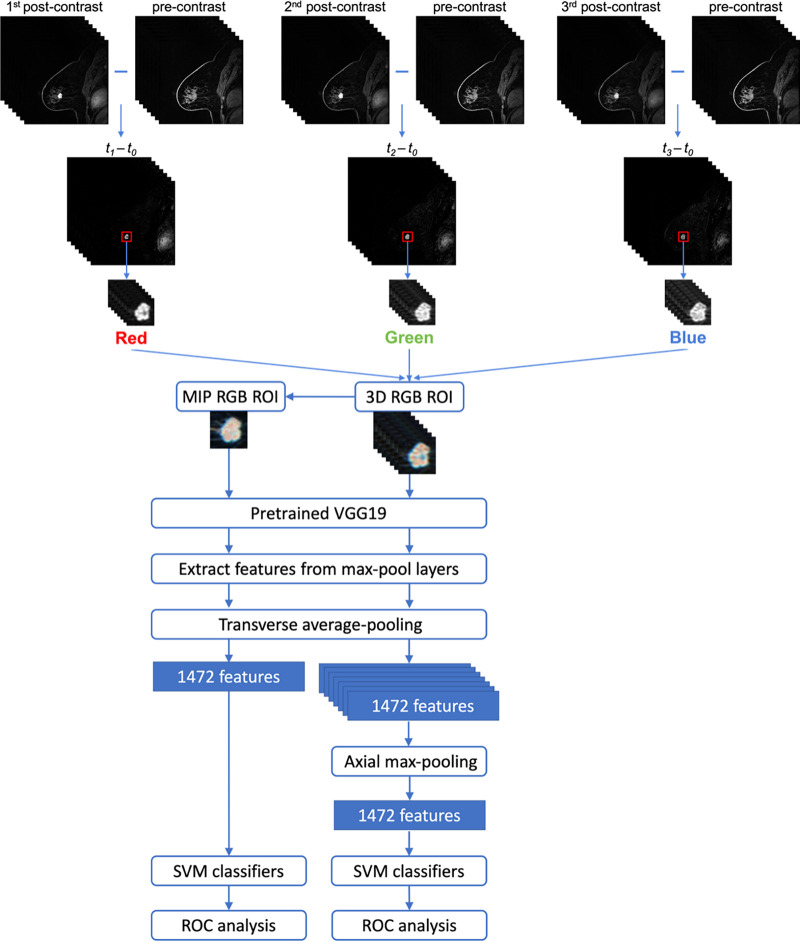
Lesion classification pipelines for image maximum intensity projection (MIP) and feature MIP. The top portion illustrates the construction of the region of interest (ROI) that incorporates volumetric and temporal information from the four-dimensional dynamic contrast-enhanced MRI sequence. The same ROI was cropped from the first, second, and third postcontrast subtraction images and combined in the red, green, and blue (RGB) channels to form a three-dimensional (3D) RGB ROI. For image MIP (left branch of the bottom portion), the MIP RGB ROI was generated from the 3D RGB ROI, collapsing volumetric lesion information at the image level. For feature MIP (right branch of the bottom portion), volumetric lesion information was integrated at the feature level by max-pooling the features extracted from all sections. SVM = support vector machine, VGG = Visual Geometry Group model.

Lesion classification pipelines for image maximum intensity projection (MIP) and feature MIP. The top portion illustrates the construction of the region of interest (ROI) that incorporates volumetric and temporal information from the four-dimensional dynamic contrast-enhanced MRI sequence. The same ROI was cropped from the first, second, and third postcontrast subtraction images and combined in the red, green, and blue (RGB) channels to form a three-dimensional (3D) RGB ROI. For image MIP (left branch of the bottom portion), the MIP RGB ROI was generated from the 3D RGB ROI, collapsing volumetric lesion information at the image level. For feature MIP (right branch of the bottom portion), volumetric lesion information was integrated at the feature level by max-pooling the features extracted from all sections. SVM = support vector machine, VGG = Visual Geometry Group model.