. 2021 Feb 24;3(3):e200159. doi: 10.1148/ryai.2021200159

Figure 4:

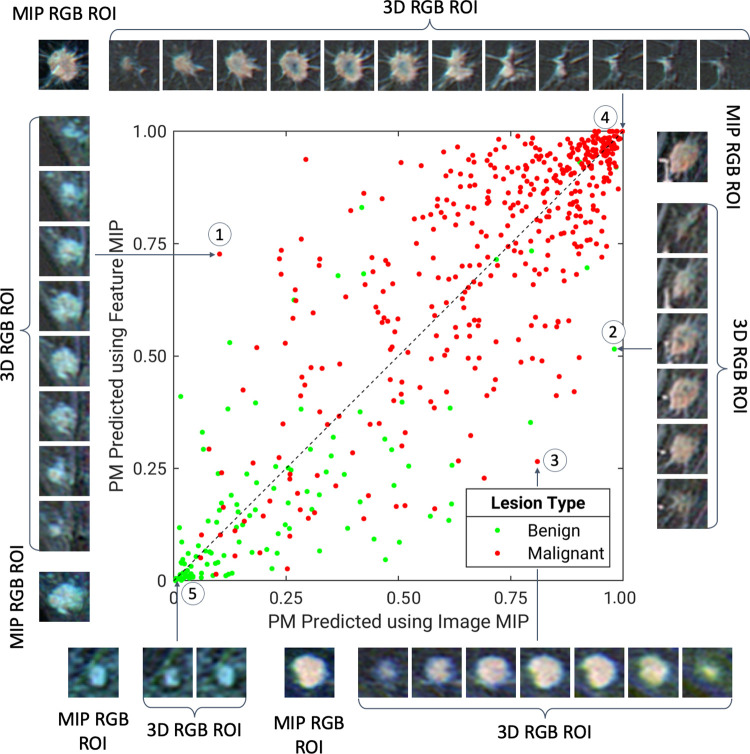
A diagonal classifier agreement plot between the image maximum intensity projection (MIP) and feature MIP methods. The x-axis and y-axis denote the probability of malignancy (PM) scores predicted by the image MIP classifier and feature MIP classifier, respectively. Each point represents a lesion for which predictions were made. Points along or near the diagonal from bottom left to top right indicate high classifier agreement; points far from the diagonal indicate low agreement. The insets are the MIP regions of interest (ROIs) and three-dimensional (3D) ROIs, which served as convolutional neural network inputs for the image MIP and feature MIP methods, respectively, of extreme examples for which using feature MIP resulted in more accurate predictions than using image MIP (lesions 1–2), for which using image MIP resulted in more accurate predictions than using feature MIP (lesion 3), and for which the two methods both predict accurately (lesions 4–5). Lesion 1 is an invasive micropapillary carcinoma, lesion 2 is fibromatosis, lesion 3 is a grade II invasive ductal carcinoma, lesion 4 is a grade II invasive ductal carcinoma, and lesion 5 is a nonmass enhancement fibroadenoma. RGB = red, green, and blue.

A diagonal classifier agreement plot between the image maximum intensity projection (MIP) and feature MIP methods. The x-axis and y-axis denote the probability of malignancy (PM) scores predicted by the image MIP classifier and feature MIP classifier, respectively. Each point represents a lesion for which predictions were made. Points along or near the diagonal from bottom left to top right indicate high classifier agreement; points far from the diagonal indicate low agreement. The insets are the MIP regions of interest (ROIs) and three-dimensional (3D) ROIs, which served as convolutional neural network inputs for the image MIP and feature MIP methods, respectively, of extreme examples for which using feature MIP resulted in more accurate predictions than using image MIP (lesions 1–2), for which using image MIP resulted in more accurate predictions than using feature MIP (lesion 3), and for which the two methods both predict accurately (lesions 4–5). Lesion 1 is an invasive micropapillary carcinoma, lesion 2 is fibromatosis, lesion 3 is a grade II invasive ductal carcinoma, lesion 4 is a grade II invasive ductal carcinoma, and lesion 5 is a nonmass enhancement fibroadenoma. RGB = red, green, and blue.