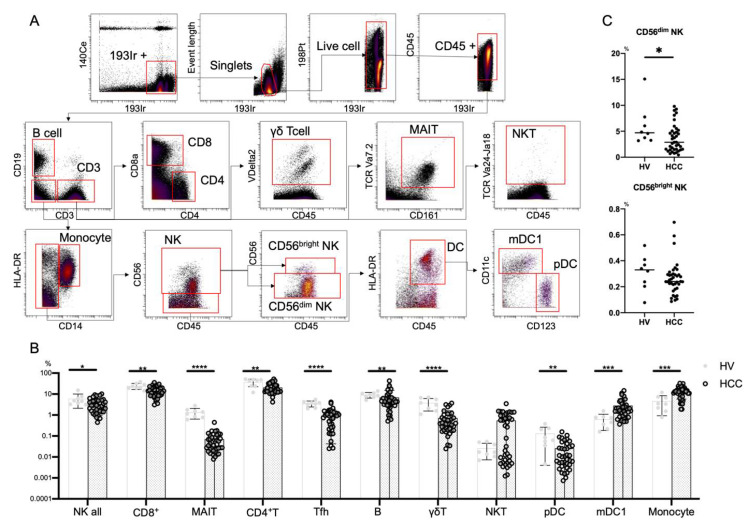
Figure 1.
Frequencies of immune cells in HCC patients. (A) Mass cytometry gating scheme used to identify the peripheral blood immune cell subsets investigated here. Arrows indicate the gating sequence. (B) Summary of the frequency frequencies of the indicated immune cell populations isolated from healthy volunteers (HVs) (n = 8) and HCC patients (n = 39). (C) Percentages of CD56dim NK cells and CD56bright NK cells among total peripheral blood mononuclear cells from HVs (n = 8) and HCC patients (n = 39). Data are presented as means ± SD (B,C). * p < 0.05; ** p < 0.01; *** p < 0.001; **** p < 0.0001 by the Mann–Whitney U-test (B,C).

