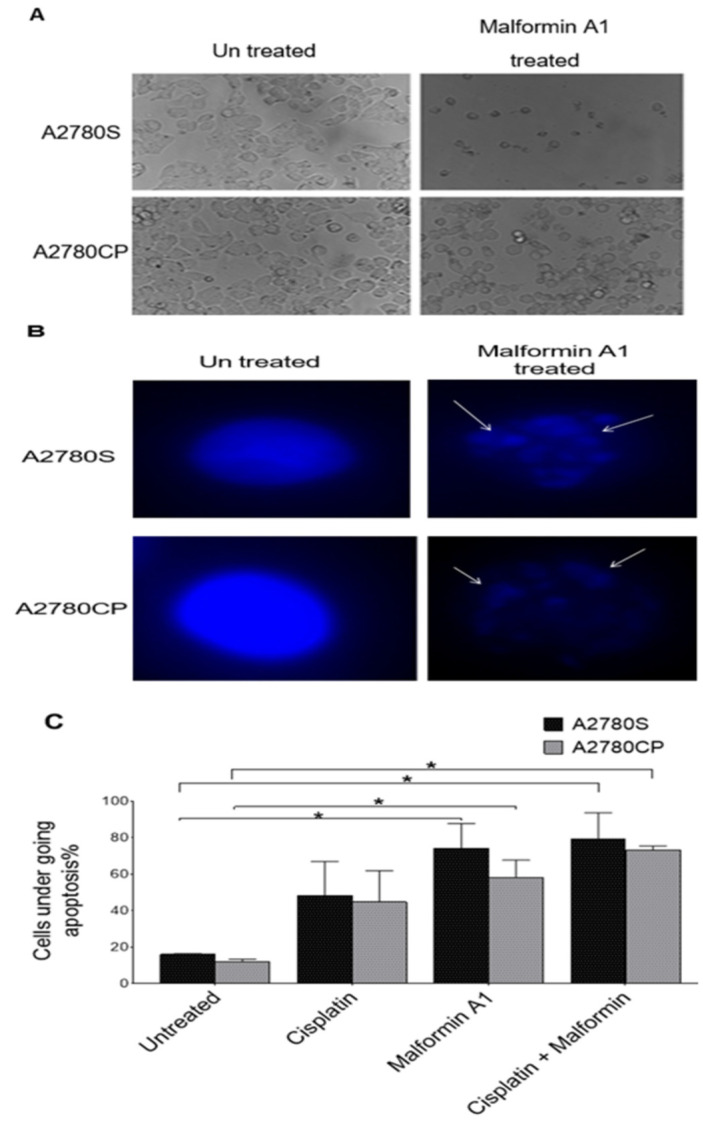
Figure 2.
Cells’ morphology changes upon treatment with MA1: (A) Morphology of untreated ovarian cancer cell lines and Malformin A1 treated cells; (B) the nucleus major changes, as visualized by fluorescent microscopy following Hoechst stain using at 40× magnification. (C) The percentage of affected cells treated with MA1 compared to cisplatin treatments. Manual counts were performed blindly by three experienced observers on randomly selected fields containing at least 200 cells. * p < 0.05.

