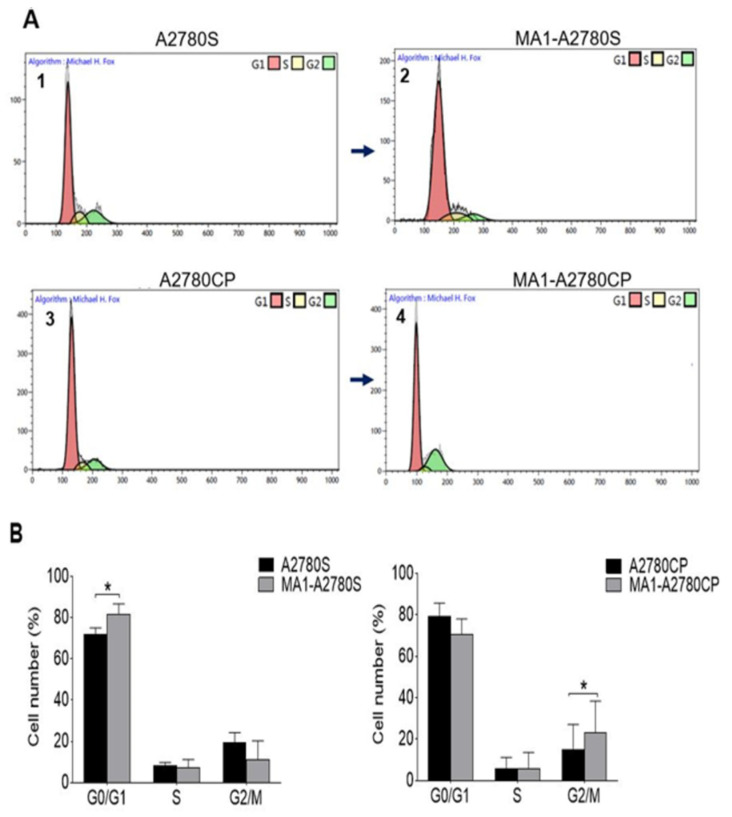
Figure 5.
(A) Cell cycle analysis by flow cytometry based on propidium-iodide intercalation into the cellular chromatin. Data are presented as a relative fluorescence intensity in a 2-dimensional flow cytometry profile; (1) and (3) were untreated samples versus (2) and (4) treated samples for 24 h. (B) Comprehensive bar diagram of subpopulations of G0/G1, S, and G2/M. Ten thousand events were analyzed for each sample. Data represent the mean ± SE of three experiments at each concentration. * p < 0.05.

