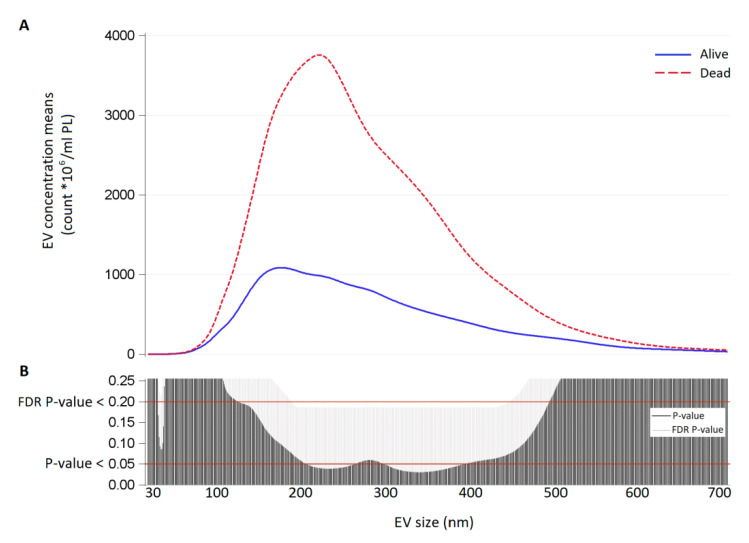
Figure 3.
(A) EV concentration means (count × 106/mL) for each size (30–700 nm) in tracheal fluid samples of survivors (continuous blue line) and non-survivors (dashed red line). (B) Significance of the difference between survivors and non-survivors for each EV size expressed as p-value and False Discovery Rate p-value from Poisson regression models allowing for over-dispersion.

