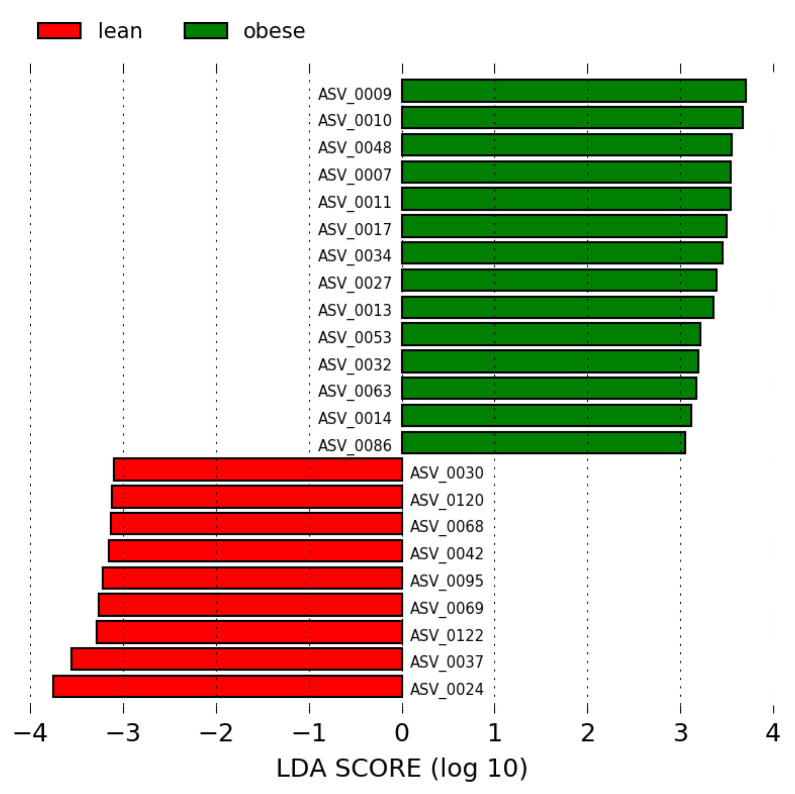
Figure 2.
LEfSe analysis between the overweight/obese (green) and lean (red) groups (LDA score > 3.0). The LDA score (log10) for the most prevalent ASV in the overweight/obese group is represented on a positive scale and the LDA score for the most prevalent ASV in the lean group is represented on a negative scale.

