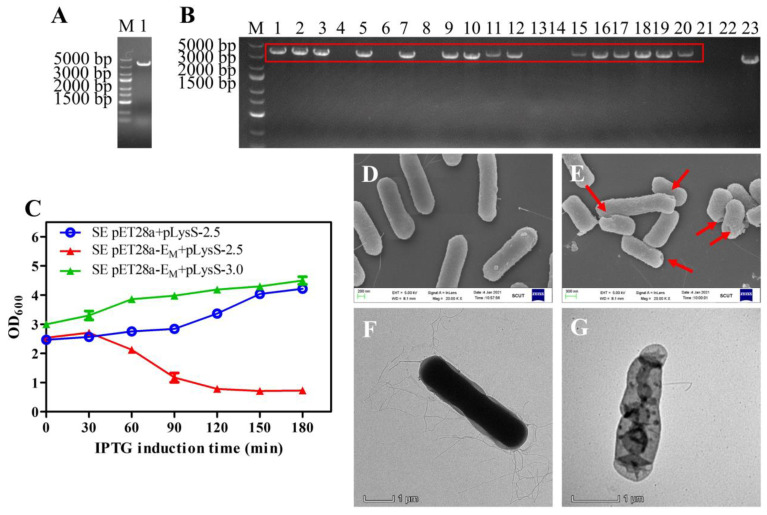
Figure 5.
Gel electrophoresis analysis for PCR production of T7 RNAP connected with 50-bp homology arms (A). Gel electrophoresis analysis for SE and SE engineered strains (B). PCR productions of SE engineered strains (lanes 1, 2, 3, 5, 7, 9, 10, 11, 12, 15, 16, 17, 18, 19, 20) and SE wild type (lane 23) with primer 3 and primer 4 were analyzed by gel electrophoresis, where positive bands (3580 bp) are marked in a red box, and the size of the control band was 2740 bp. The lysis curves of the SE engineered strains containing pET28a-EM and pLysS at late-log phase were analyzed. The OD600 values at different times are presented in the format of mean ± S.D (C). An amount of 0.1 mM IPTG was added to the cultures at time point 0, the same as in E. coli. SEM and TEM analysis of SE engineered strains before and after lysis was carried out (D–G). Untreated control SE cells (D) and the SE ghosts (E) were observed by SEM. The red arrows indicate the lysis transmembrane tunnels. Untreated control SE cells (F) and the SE ghost (G) were observed by TEM.

