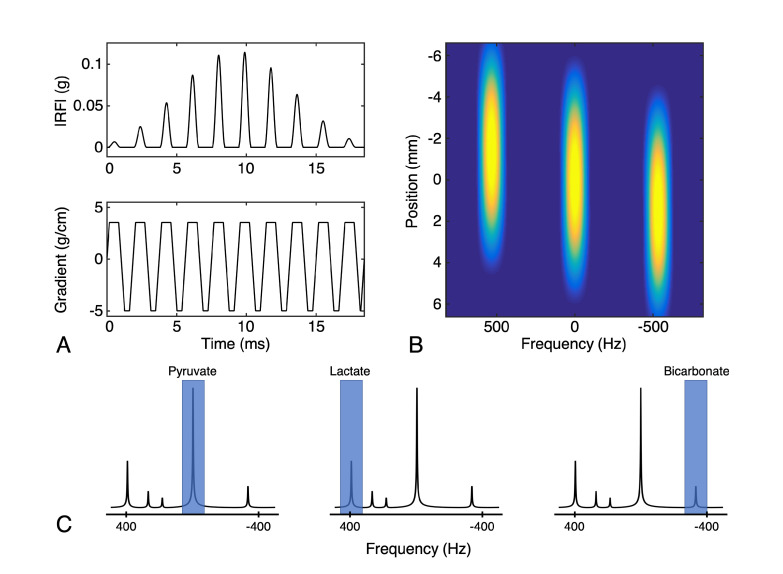
Figure 4.
Illustration of the metabolite-selective imaging technique. (A) Example of a spectral-spatial RF pulse designed for studies of HP [1-C]pyruvate and [1-C]lactate. The RF envelope and oscillating gradient provide the spectral and spatial selectivity of the 2D RF pulse. (B) The transverse magnetization (Mxy) excited by this pulse shows the narrow passband frequency response needed for metabolite-selective imaging as well as slice-selectivity for spatial localization. (C) The singleband spectral-spatial RF pulse performs the spectral encoding by exciting a single metabolite within a narrow passband (highlighted in blue) over a single slice (or slab). A rapid imaging readout trajectory is then used to spatially encode the magnetization as a 2D multi-slice or 3D phase-encoded dataset. The acquisition then shifts the center frequency and cycles through the resonances of interest (pyruvate, lactate, and bicarbonate at 3T in this example) over time to acquire dynamic data for each metabolite.

