Figure 3.
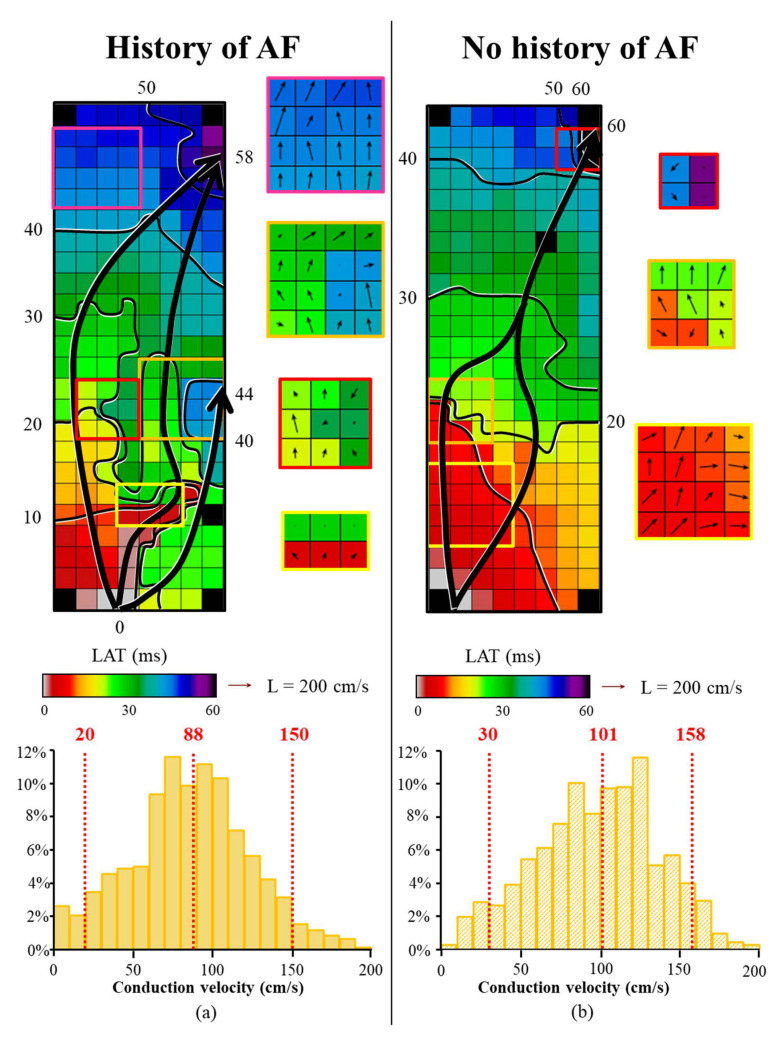
Color-coded activation maps and corresponding CV histograms at BB of a patient with and without a history of AF. The upper panel shows two examples of a color-coded activation maps at BB obtained from a patient with a history of AF (a) and a patient without a history of AF (b). Corresponding CV maps are depicted next to the activation map. CV vectors are depicted per electrode. In the patient with AF, a large area of slowing of conduction is present in the lower part of the activation map, represented by crowding of isochrones. The colored boxes indicate smooth wavefront propagation (pink rectangle) and local conduction heterogeneities (yellow, red and orange rectangles). In the patient without AF, the sinus rhythm wavefront encounters only some small areas of conduction delay (orange and red rectangles). Isochrones (black lines) drawn at 10 ms. The black arrows indicates the main wave direction. Lower panel: corresponding CV histograms of the patient with AF (a) and without AF (b) recorded at BB. The dashed lines represent the 5th, 50th and 95th percentiles of the relative frequency distribution of CVs. cm/s = centimeter/second; ms = milliseconds; BB = Bachmann’s bundle; CV = conduction velocity; LAT = local activation time.

