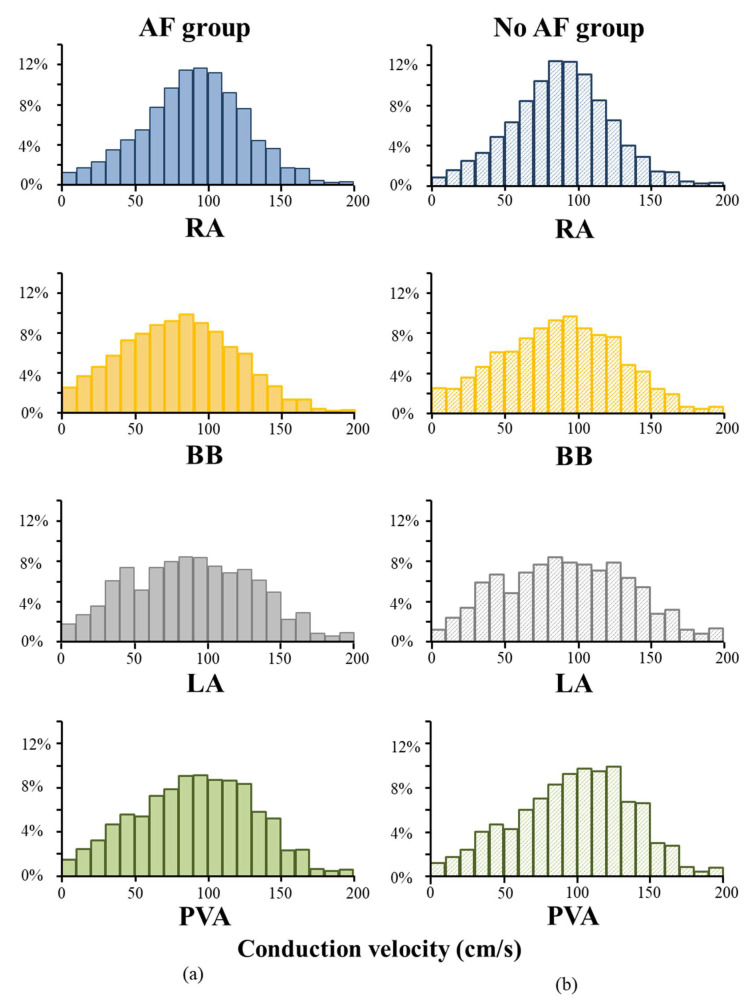
Figure 4.
CV histograms of the AF and no AF group. Relative frequency distributions of CVs in the AF (a) and no AF group (b) shown for each location separately. cm/s = centimeter/second; AF = atrial fibrillation; BB = Bachmann’s Bundle; LA = left atrium; PVA = pulmonary vein area; RA = right atrium.

