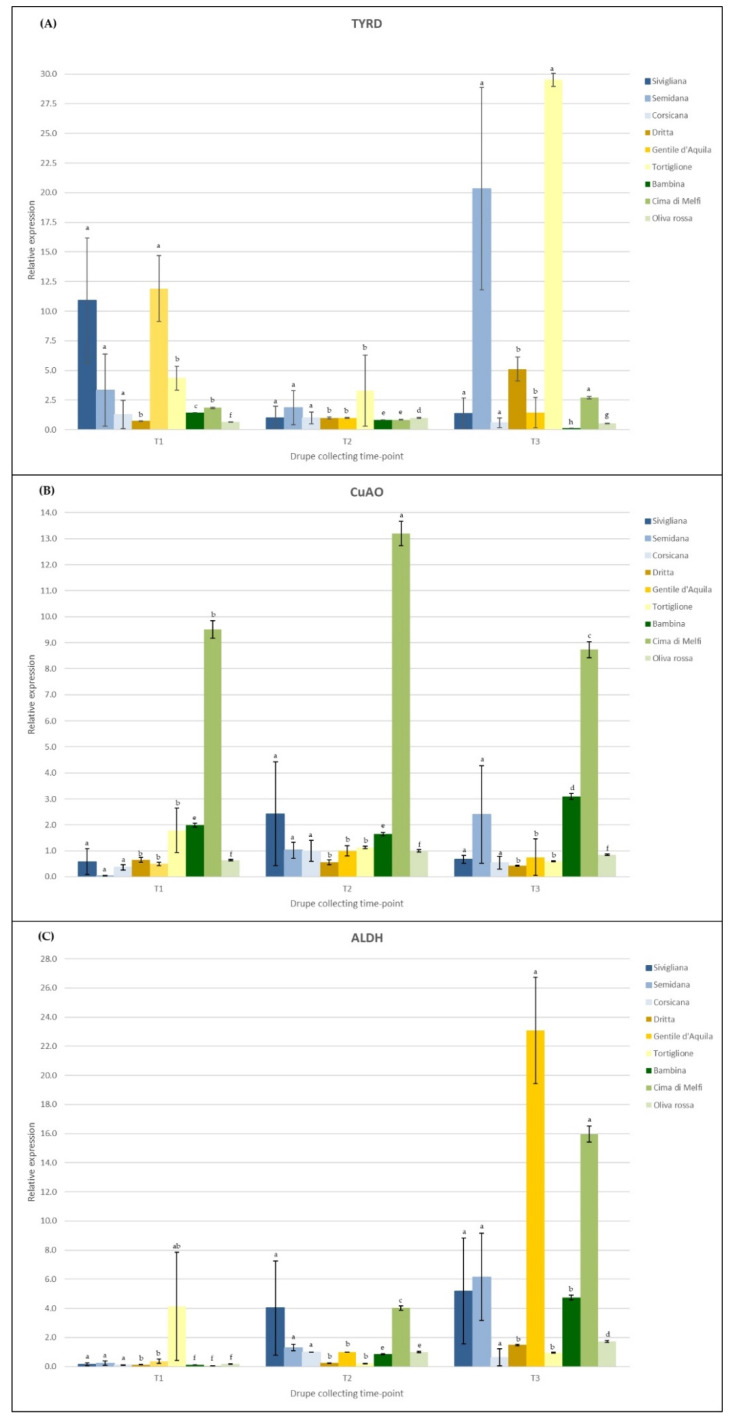
Figure 3.
Expression profiles of the analyzed genes involved in the first step of the phenol biosynthetic pathway during fruit development (T1 = yellow-green drupes, T2 = turning drupes, T3 = almost dark drupes). The mRNA levels were determined by qRT-PCR and relatively expressed as ΔΔCt. (A) TYRD = tyrosine/dopa decarboxylase; (B) CuAO = copper amine oxidase; (C) ALDH = alcohol dehydrogenase. Data are means (n = 3) ± standard deviation. Different letters indicate significant differences according to one-way ANOVA followed by Fisher’s LSD post-hoc test (p = 0.05).

