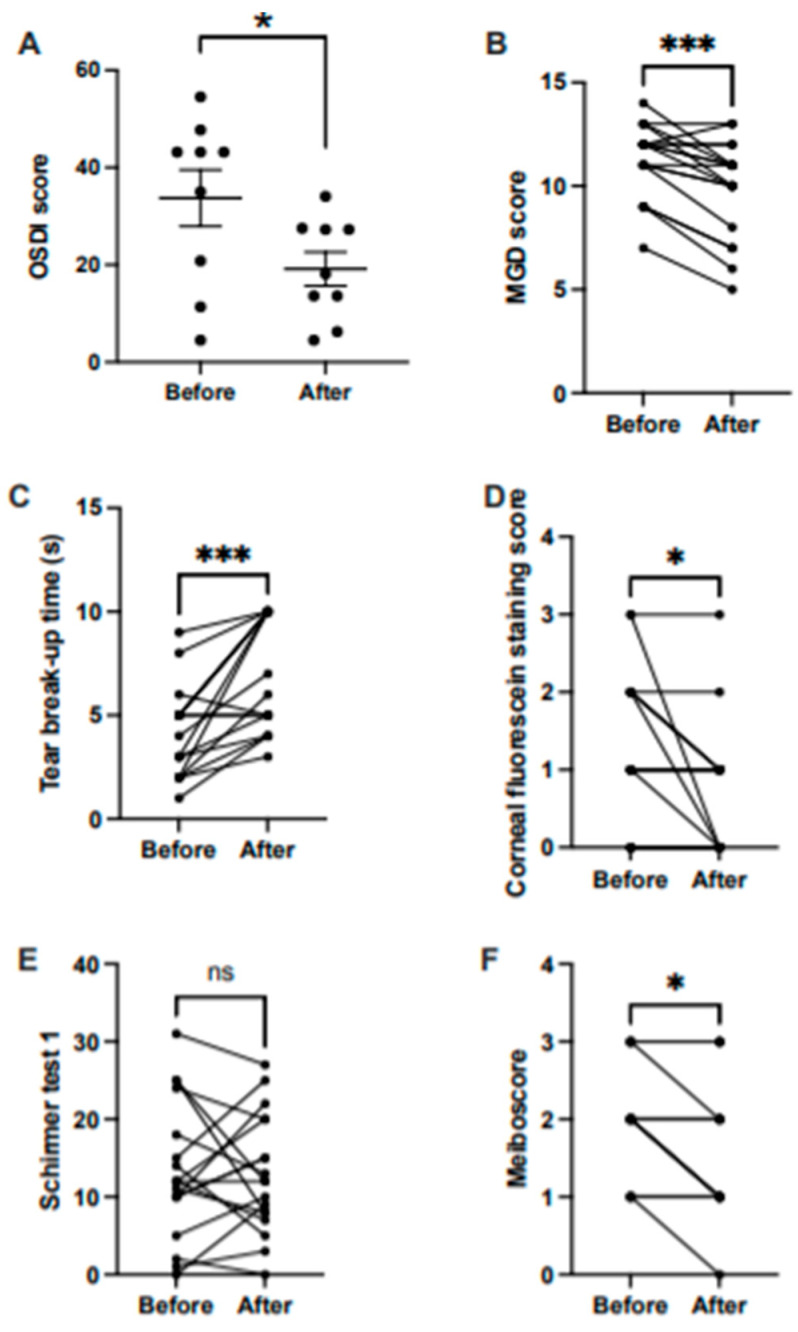
Figure 1.
Treatment effect before and after treatment on (A) OSDI score (horizontal bars represent means, and error bars represent the standard error of the mean, SEM); (B) MGD score; (C) tear break-up time; (D) corneal fluorescein staining score; (E) Schirmer 1 test; and (F) meiboscore. Lines shown in B, C, D, E, and F represent outcomes before and after treatment. s, seconds. * p < 0.05; *** p < 0.005; ns, non-significant.

