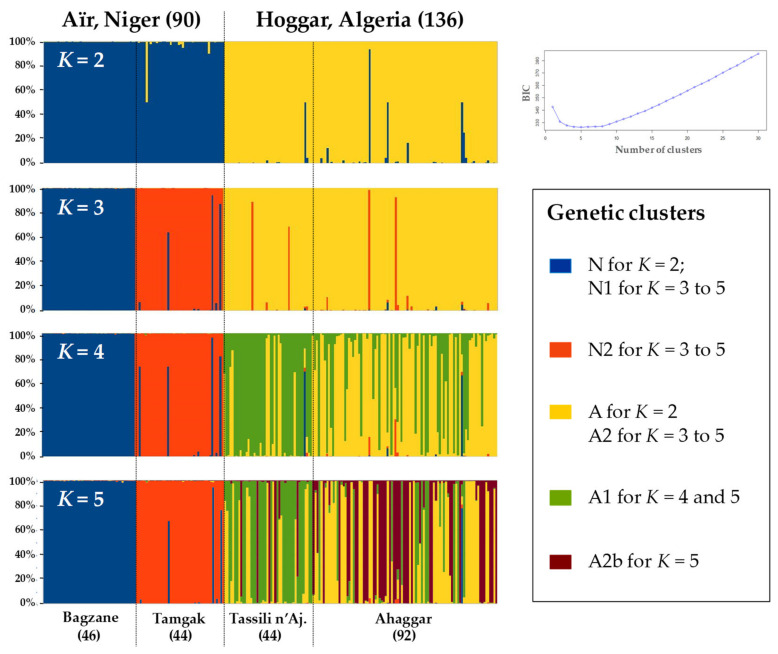
Figure 4.
Inference of population structure using Bayesian simulations with snapclust [50] based on 226 SSR genotypes with no missing data. On the right, Bayesian Information Criterion (BIC [53]) values over 20 iterations per K indicate that the best K value is 5. On the left, barplots of the snapclust analyses based on K = 2 to 5 are shown. The percentage (p) of assignment of each individual to gene pools averaged over 20 iterations is shown. Each individual is represented by a vertical bar. The four main massifs are indicated as predefined regions. At K = 2, most individuals are correctly assigned to Aïr (N) or Hoggar (A) clusters. At K = 3, two gene pools are distinguished in Niger (N1 for Bagzane, and N2 for most individuals sampled in Tamgak). Finally, at K = 4 and 5, the Hoggar cluster is split into clusters (A1 and A2; or A1, A2 and A2b) that poorly match to each massif, suggesting a low differentiation between Tassili n’Ajjer (Tassili n’Aj.) and Ahaggar.

