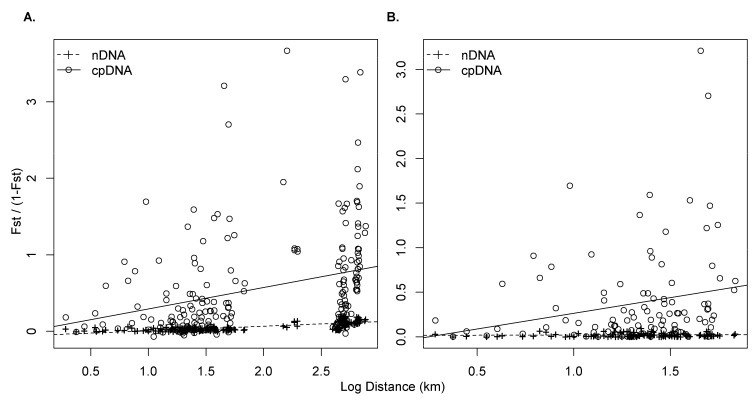
Figure 6.
Comparative analysis of the isolation by distance according to the nuclear and plastid markers at two spatial scales: (A) Central Sahara (including the four massifs; 21 localities; cpDNA: r = 0.303, p = 0.01; nuclear SSRs (nDNA): r = 0.153, p = 0.01), and (B) Ahaggar (15 localities; cpDNA: r = 0.209, p = 0.10; nuclear SSRs (nDNA): r = 0.143, p = 0.17). FST / (1 − FST) was plotted against the logarithm of geographic distance following Rousset [62].

