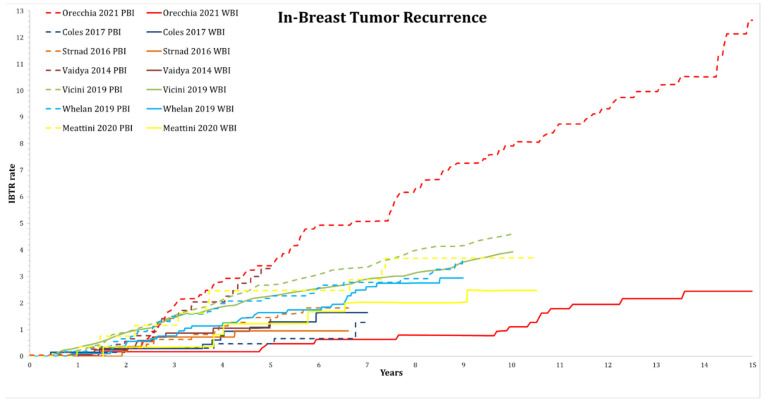
Figure A3.
Analysis of in-breast tumor recurrences (rate in %) of randomized trials, where long-term graphical assessment was available. Trials are grouped by color. Solid lines represent whole-breast irradiation arms and dashed lines represent partial-breast irradiation arms. Graphs were extracted from the original publications.

