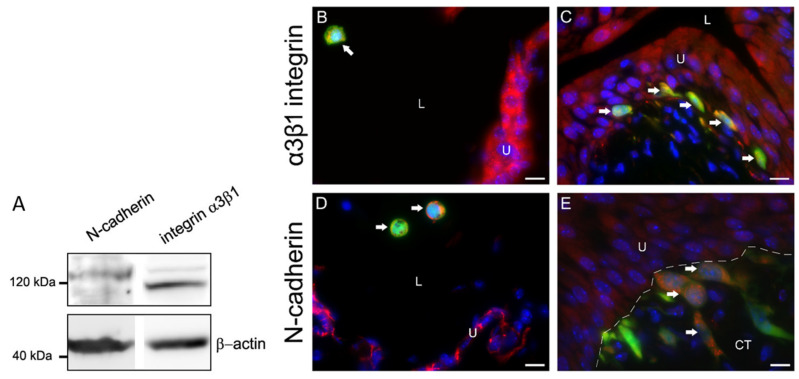
Figure 3.
Expression of α3β1 integrin and N-cadherin in MB49-GFP cancer cells with internalized nanoparticles in vitro and in vivo. (A) Western blot analysis of MB49 cell culture lysates. The detected bands proved that MB49 cells expressed N-cadherin (120 kDa) and α3β1 integrin (117 kDa). β-actin (45 kDa) was used as a loading control. Molecular weight markers are indicated. (B,D) GFP-transduced and α3β1 integrin- or N-cadherin-positive cancer cells (arrows) (orange-colored, due to merged green fluorescence of GFP and red fluorescence of α3β1 integrin or N-cadherin) in floating cancer cells (arrows) in the lumen of the bladder 1 hour after intravesical application. (C,E) GFP-transduced and α3β1 integrin- or N-cadherin-positive cancer cells (arrows) (orange-colored, due to merged green fluorescence of GFP and red fluorescence of α3β1 integrin or N-cadherin) under the basal lamina 72 h after intravesical application. Note dark spots of no fluorescence inside cancer cells, representing internalized nanoparticles in endosomes (in (B,D)). Nuclei were stained with DAPI (blue fluorescence). The dashed line represents the basal lamina. U—urothelium; L—lumen of the urinary bladder; CT—connective tissue. Bars are 10 µm.

