Figure 6.
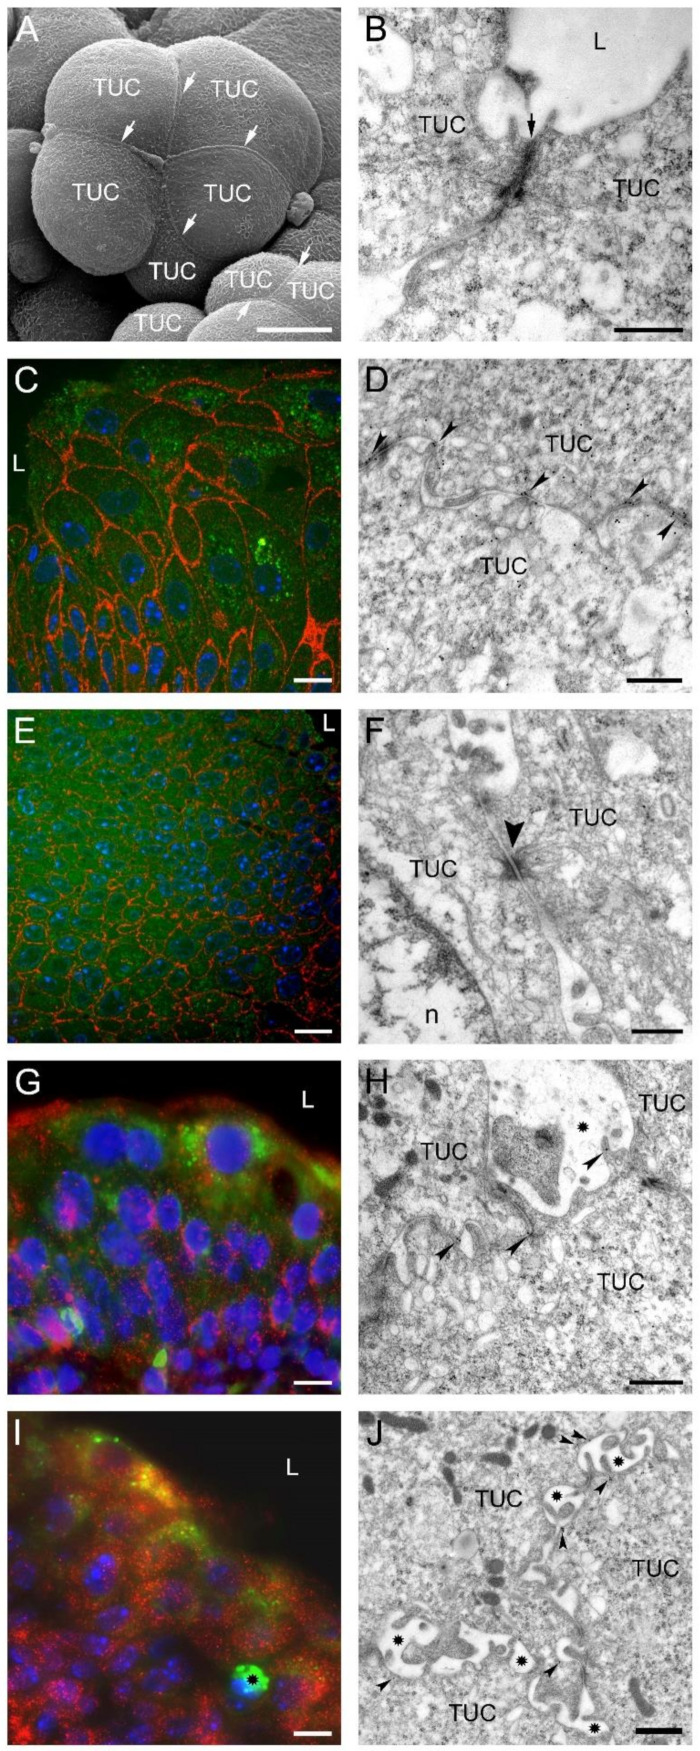
Intercellular junctions between urothelial cells in tumors developed 3 weeks after intravesical application of MB49-GFP cancer cells. Scanning electron micrograph (A) and transmission electron micrograph (B) of superficial tumor urothelial cells (TUC) connected by well-developed tight junctions (arrows). (C) Strong immunofluorescence reaction against β-catenin (red fluorescence) on boundaries of tumor urothelial cells (green fluorescence due to GFP). Nuclei were stained with DAPI. (D) Immunogold labeling of β-catenin (arrowheads) on lateral plasma membranes between two adjacent TUC. (E) Pronounced immunofluorescence reaction against desmoplakins 1 and 2 (red fluorescence) on boundaries of tumor urothelial cells (green fluorescence due to GFP). Nuclei were stained with DAPI. (F) Ultrastructure of two adjacent TUC connected by desmosome (arrowhead). (G) Punctate cytoplasmic and membranous immunofluorescence reaction against N-cadherin (red fluorescence) in tumor urothelial cells (green fluorescence due to GFP). Nuclei were stained with DAPI. (H) Immunogold labeling of N-cadherin (arrowheads) on lateral plasma membranes between adjacent TUC. Note heavily enlarged intercellular space (asterisk) between cells. (I) Strong punctate cytoplasmic immunofluorescence reaction to α3β1 integrin (red fluorescence) in all tumor urothelial cells (green fluorescence due to GFP). Nuclei were stained with DAPI. Asterisk denotes a macrophage. (J) Immunogold labeling of α3β1 integrin (arrowheads) on lateral plasma membranes between adjacent TUC. Enlarged intercellular spaces were present between them (asterisks). L—lumen of the urinary bladder; n—nucleus. Bars are 10 µm (A,C,E,G,I), 600 nm (B,D,H,J), 300 nm (F).

