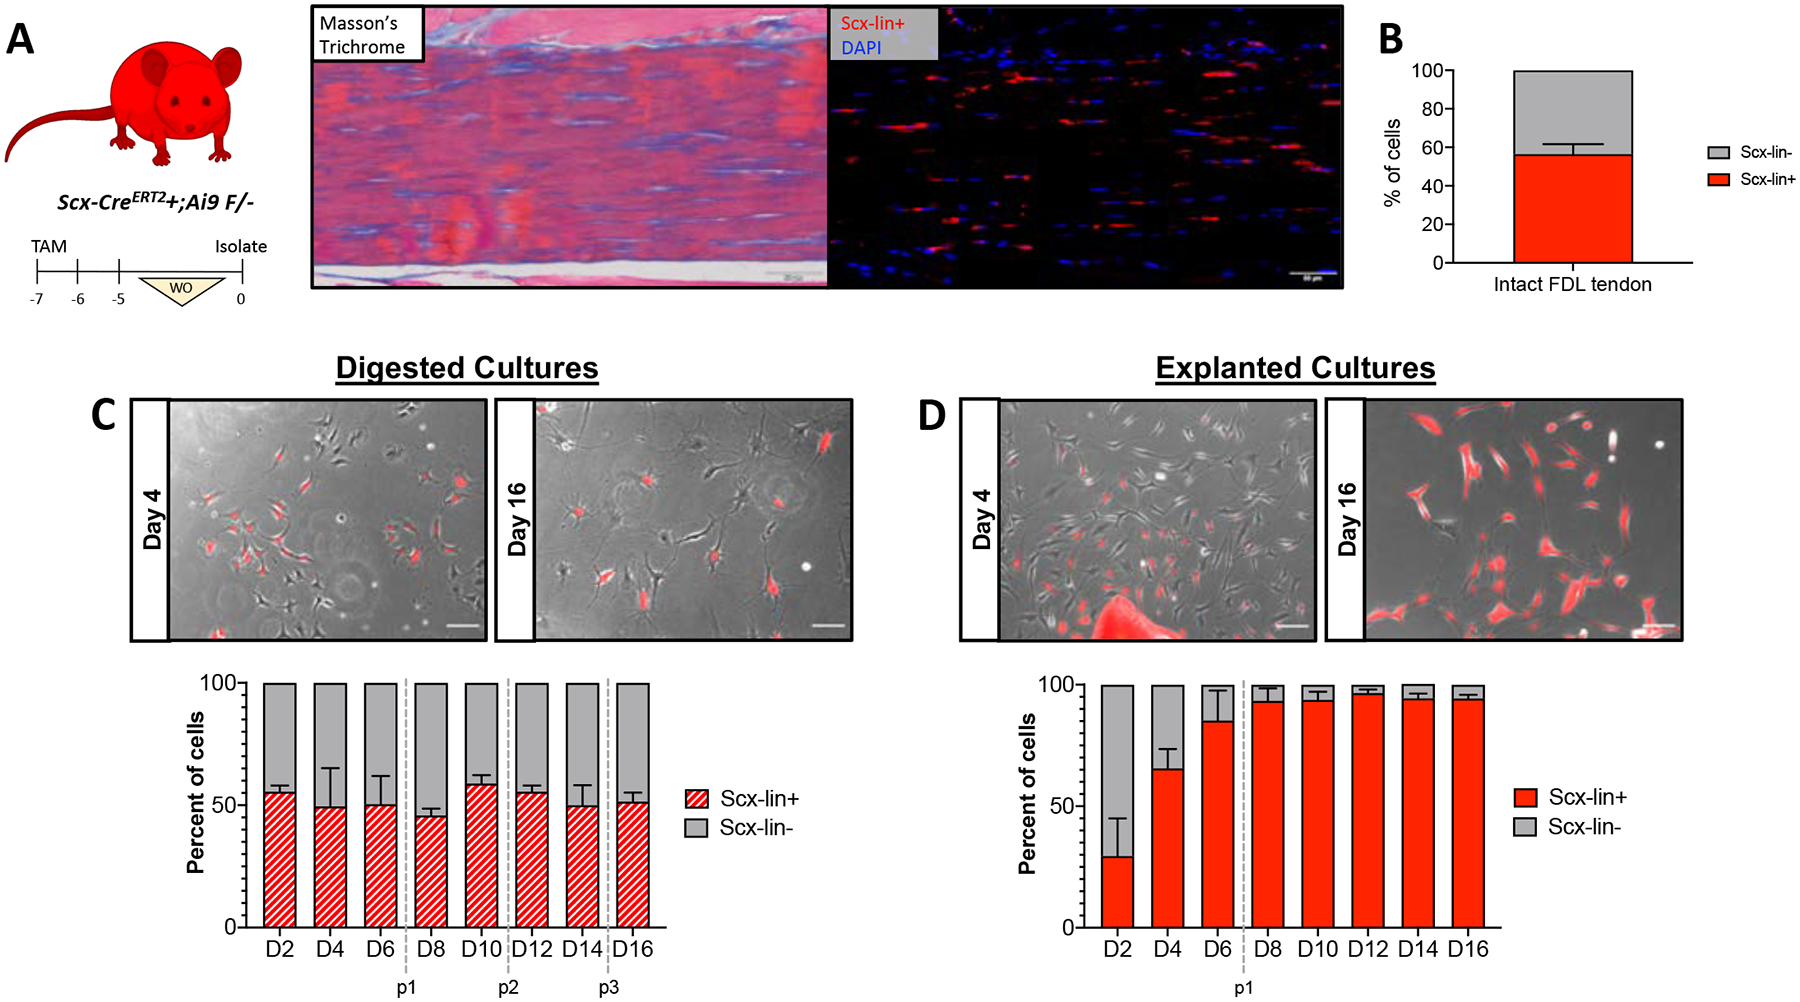
Figure 4: Ratio of of Scx-lin+/Scx-lin- cells in culture depends on isolation method.

Scx;Ai9 mice were injected with TMX to label Scx-lin+ cells (A). Representative images showing intact FDL tendon (Masson’s Trichrome; left) and Ai9 labeling (immunofluorescence; right) of tendon cells in the same area using the described TMX regimen. Scale bars = 50 μm. Quantification (B) of Scx-lin+ and Scx-lin- tendon cells in intact FDL tendons. n=4. Representative images (C,D; top) and quantification (bottom) of Scx-lin+ (red) and Scx-lin- (gray) tendon cells isolated by digest (C) or explant culture (D). Passages are indicated by vertical gray dotted lines. Scale bars = 100 μm. n=3. Mouse model schematic was created using www.biorender.com.
