
FIGURE 4.
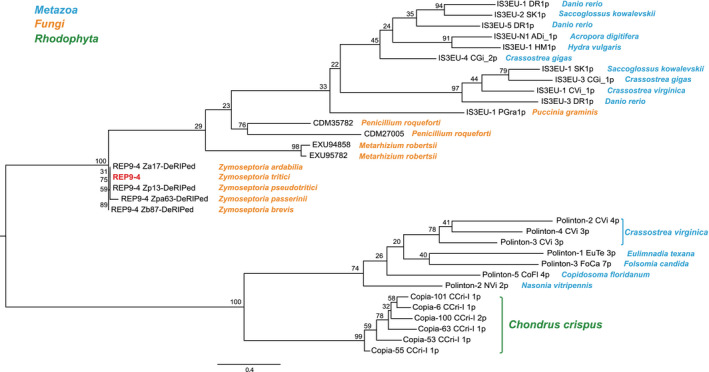
Phylogenetic analysis of REP9‐4. Maximum‐likelihood (ML) phylogenetic tree of the conserved RVE domain. Numbers next to each branch represent bootstrap support values (%) from 1,000 bootstrap replicates. The scale bar at the bottom is distance in substitutions/site. Species names are listed next to either the NCBI accession number or the transposon name in RepBase. These names are coloured according to the legend located at the top left