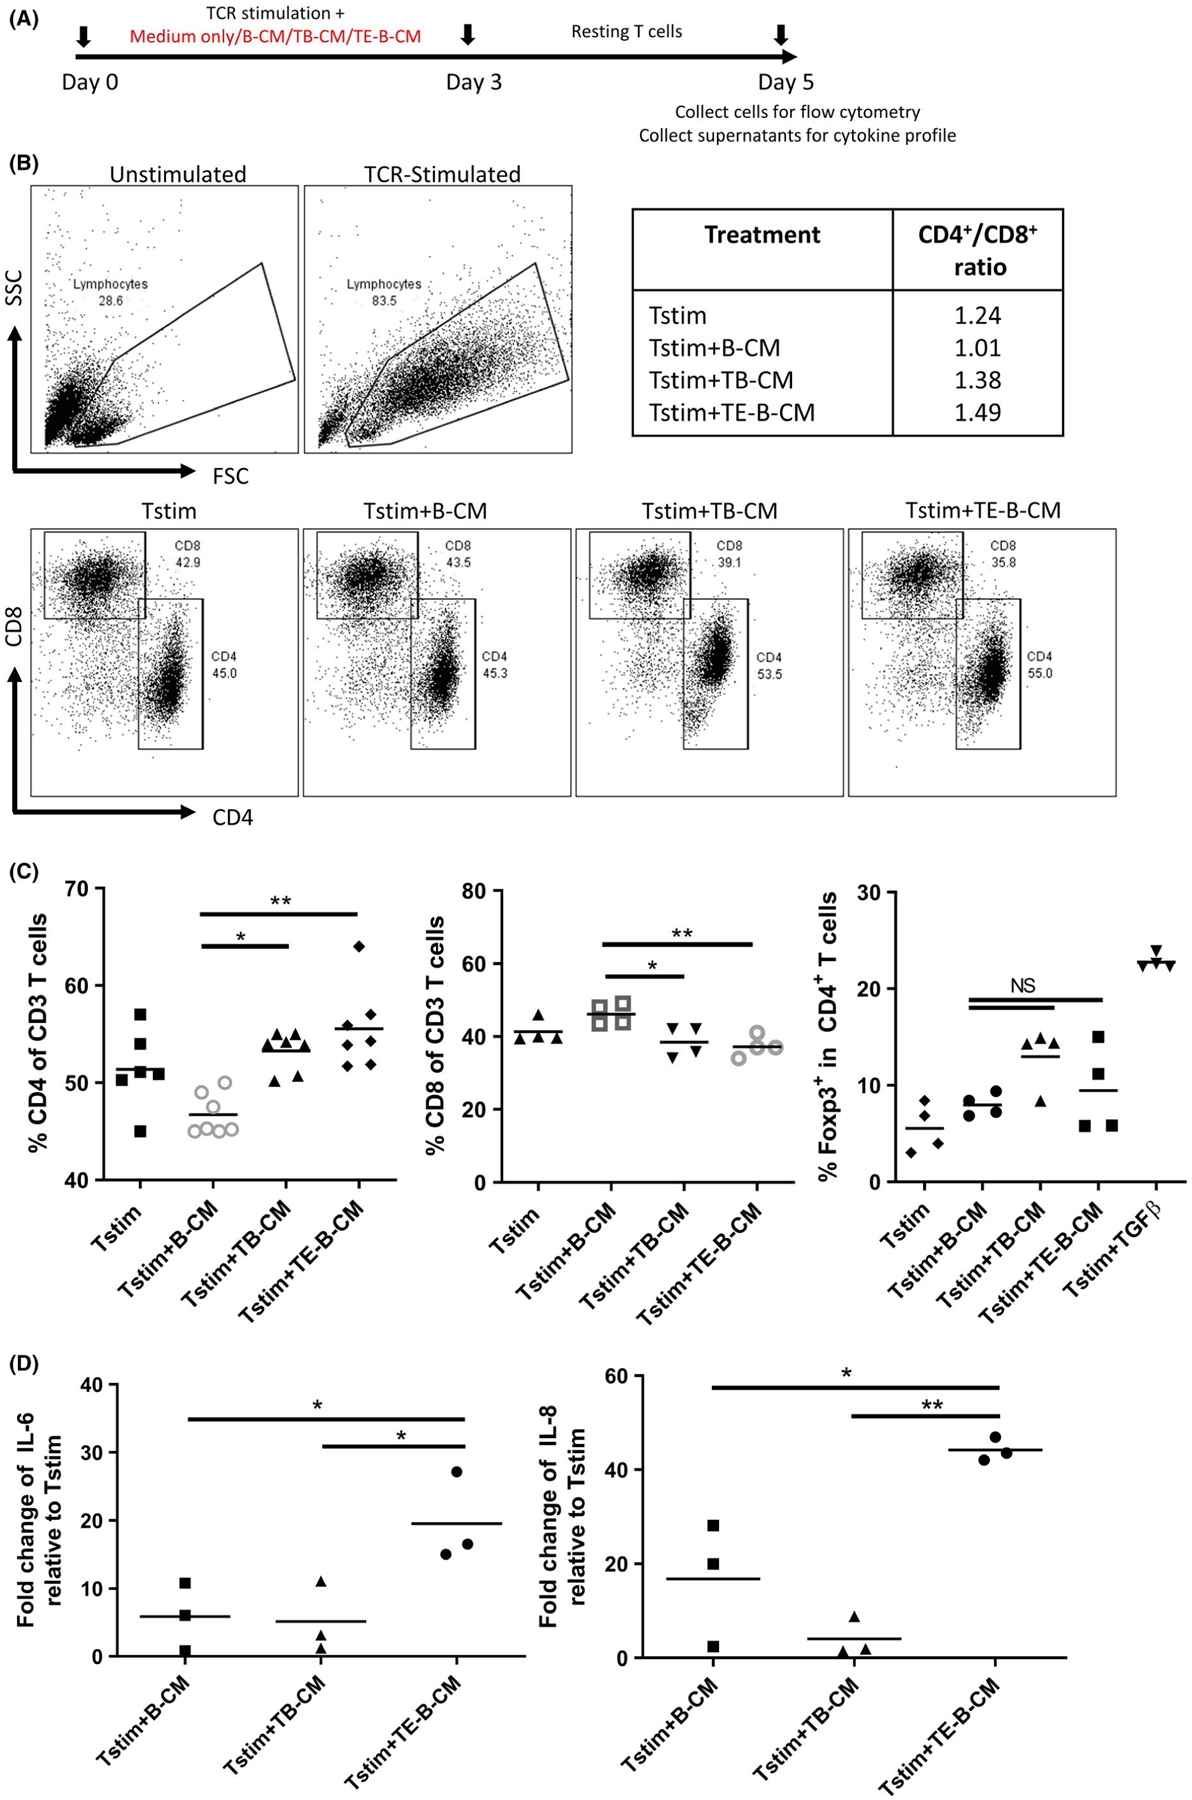
FIGURE 4.

TE-B cells impact on T-cell proliferation and cytokine production. Purified T cells were (A) TCR-stimulated with anti-CD3 and anti-CD28 antibodies in normal medium alone (Tstim), or with addition of conditioned medium obtained from cultures of normal B cells (B-CM), trophoblast cells (TB-CM), or TE-B cells (TE-B-CM). B, Representative flow cytometry plots comparing side and forward scatter of unstimulated and TCR-stimulated T cells (upper panels), the gating strategy for CD4+ and CD8+ subsets (lower panels), and the summarized CD4+/CD8+ ratios. C, Graphical presentation of data combined from a minimum of four independent experiments showing CD4+ and CD8+ T cells as a percent of all CD3+ T cells and expression of transcription factor Foxp3 in CD4+ T cells. D, Fold change increase of IL-6 and IL-8 cytokine production by proliferating T cells cultured in indicated conditioned medium over normal medium controls. *P < .05, **P < .01
