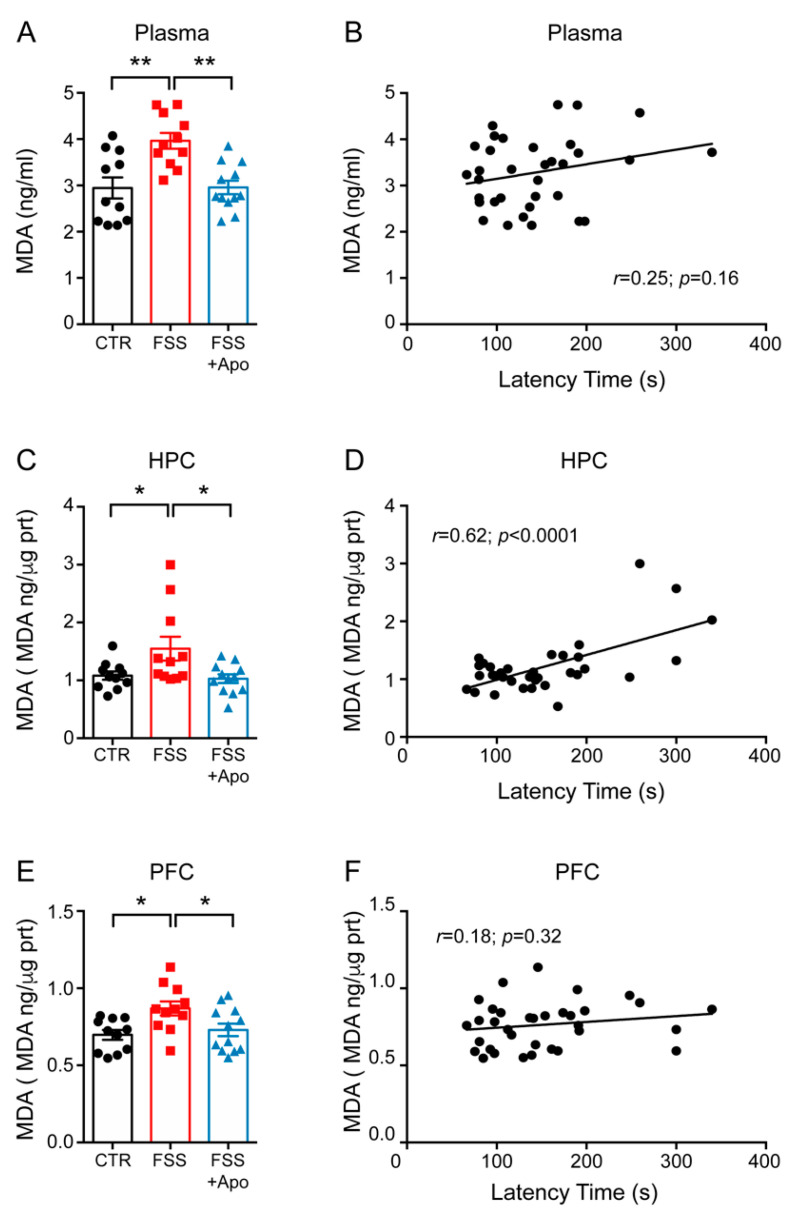
Figure 2.
Apocynin prevents the FSS-induced increase of lipid peroxidation. (A,C,E) MDA levels measured in the plasma (A), hippocamps (HPC) (C) and prefrontal cortex (PFC) (E). One-way ANOVA followed by Tukey’s post hoc analysis. Data are presented as mean ± SEM (n = 11–12 mice/group). (B,D,F) Linear correlation between the latency to feed and the MDA levels in the plasma (B), HPC (D) and PFC (F). Pearson’s correlations (n = 11–12 mice/group). * p < 0.05; ** p < 0.01.

