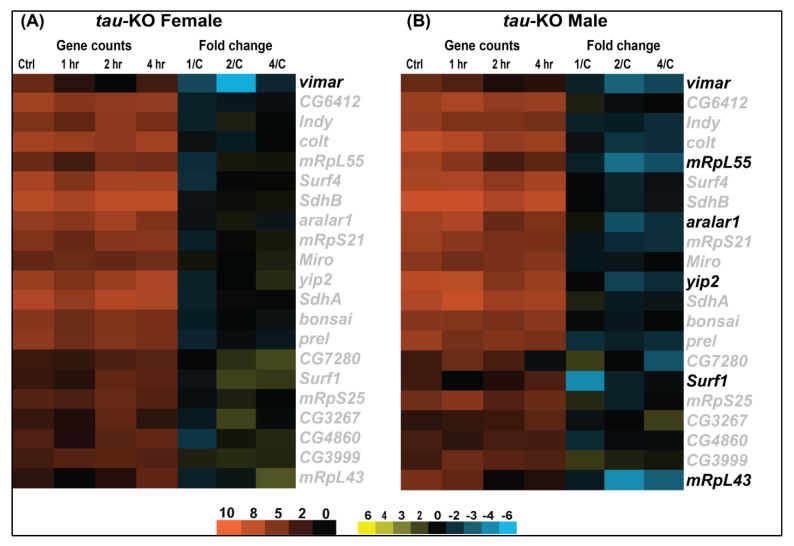
Figure 6.
Tau-KO downregulates mitochondrial gene expression changes. Heatmaps depicting mitochondrial gene expression changes in tau-KO females (A) and males (B) at control, 1, 2 and 4 h after injury. Orange scale represents the average of normalized counts for 3 replicates in each group indicated above (n = 3 for each condition: male and female at control, 1, 2, and 4 h post-TBI). Yellow-blue scale shows fold change for each gene at 1, 2- and 4-h post-injury compared to control. All genes indicated in black font are significant (|log2FC| > 1, p-value < 0.05). 1/C: Fold change at 1 h compared to control; 2/C: Fold change at 2 h compared to control and 4/C: Fold change at 4 h compared to control.

