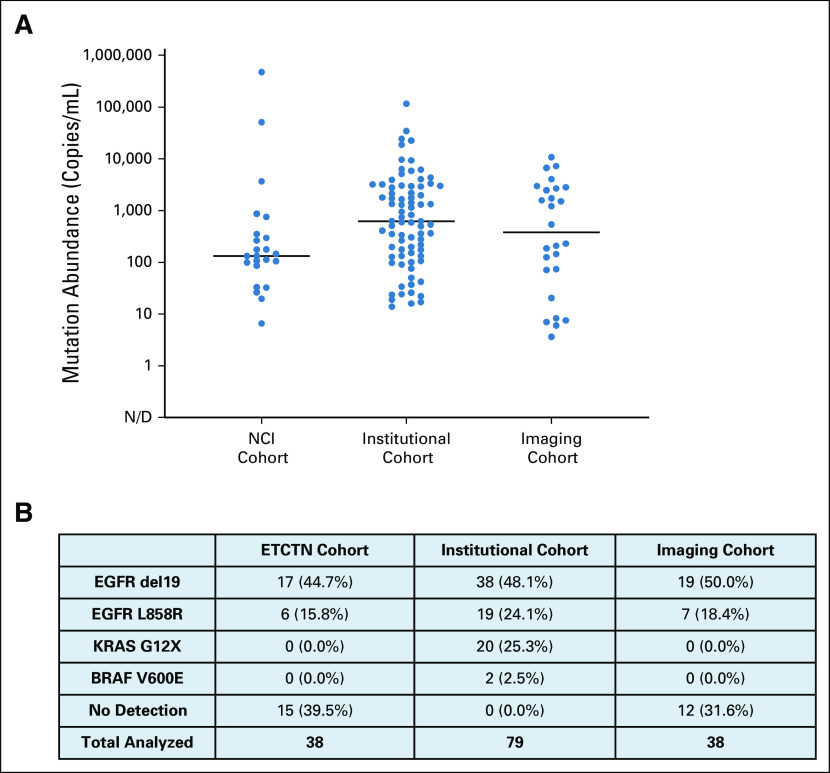
FIG A1.
Baseline driver mutation abundance detectable in plasma ctDNA. (A) Dotplot of baseline pre-treatment shed of key driver mutations EGFR del19 or L858R, KRAS G12X, or BRAF V600E across all cohorts evaluated in this study. (B) Corresponding frequency table of driver genotype as determined through ddPCR analysis of plasma ctDNA. ctDNA, circulating tumor DNA; ddPCR, droplet digital polymerase chain reaction, N/D, not defined.

