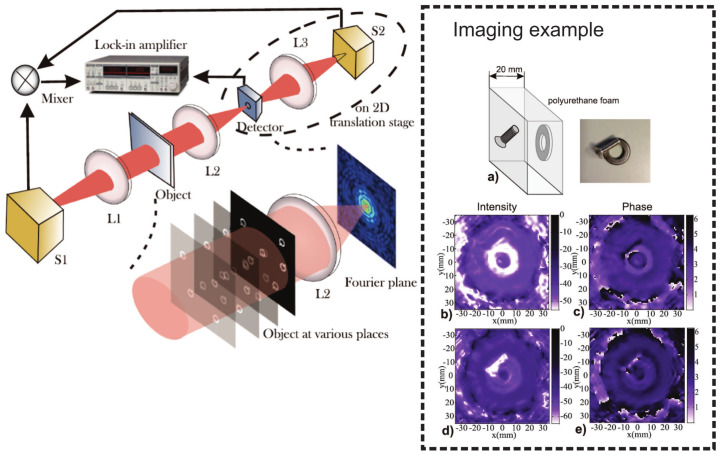
Figure 5.
Schematic of the Fourier imaging based on the heterodyne detection of nanometric FET detector at 300 GHz. Left inset: Sketch of the imaging setup. The scene is illuminated by radiation from source S1. The spatial Fourier spectrum of the scene is written in the focal plane of lens L2 (as indicated by the schematic on the lower right side of the figure) and recorded with the raster-scanned single-pixel detector. S2 works as local oscillator and is focused onto the front side of the detector by L3. L3 and S2 share the translation stage with the detector and are moved together with it (as symbolized by the dashed ellipse). Right inset: 3D imaging example (a) Left side: Washer-and-screw scene. The THz beam impinges from the left and hits first the screw and then the washer. Right side: The photograph of the washer and screw placed on a table with approximately correct projectional view. Middle panels: Intensity (b) and phase images (c) for a reconstruction distance equal to the position of the washer; lower two panels: Reconstructed intensity (d) and phase (e), but for the distance equal to that of the screw. Figure modified from Ref. [262].

