Figure 5.
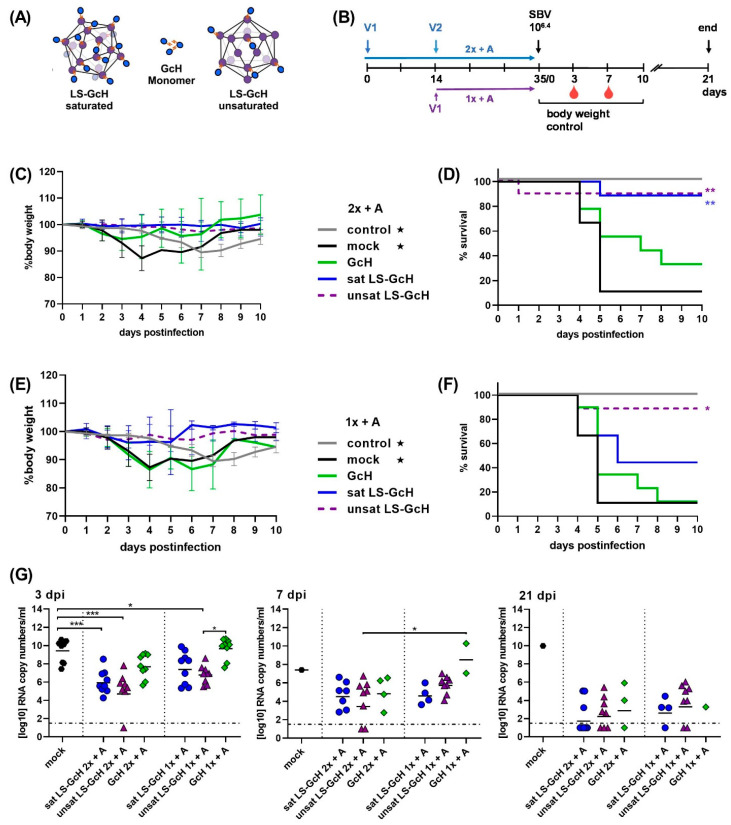
IFNAR-/- mouse trial #2. Efficacy of saturated and unsaturated LS-GcH MPSPs in comparison to monomeric GcH. (A) Schematic of vaccines used for the immunizations in this trial; (B) Experimental scheduling. V1 and V2 indicate the time-points of the 1st and 2nd vaccination; (C) Body weight development after challenge infection in groups vaccinated twice with adjuvanted vaccines (2x + A). Each line represents he mean value of the respective group with SD; (D) Survival curves in groups vaccinated 2x + A; (E) Body weight development after challenge infection in groups vaccinated once with adjuvanted vaccines (1x + A); (F) Survival curves in groups vaccinated 1x + A; For (C,E) as well as for (D,F) data of the respective control and mock groups (marked with stars) were inserted in both graphs; (G) SBV RNA detected by RT-qPCR in EDTA blood samples of surviving animals in each group at 3, 7 or 21 dpi, respectively. Dashed lines indicate the detection limit of the RT-qPCR assay. Samples of animals that succumbed to infection or had to be euthanized prior to or on the respective sampling day were not included. In (G) Statistical analysis was performed using the Kruskal–Wallis test followed by Dunn´s test for comparisons between individual groups. p values < 0.05 were considered significant. (* p < 0.05; ** p < 0.01; *** p < 0.001). Only significant differences between groups are labeled. Differences that are not significant (p > 0.05) are not separately indicated. In (D,F) significant differences compared to the mock control were calculated using the Mantel–Cox test (* 0.0332; ** 0.0021; *** 0.0002; **** <0.0001). Comparisons between all groups against each other are not indicated but are shown in Table S2.

