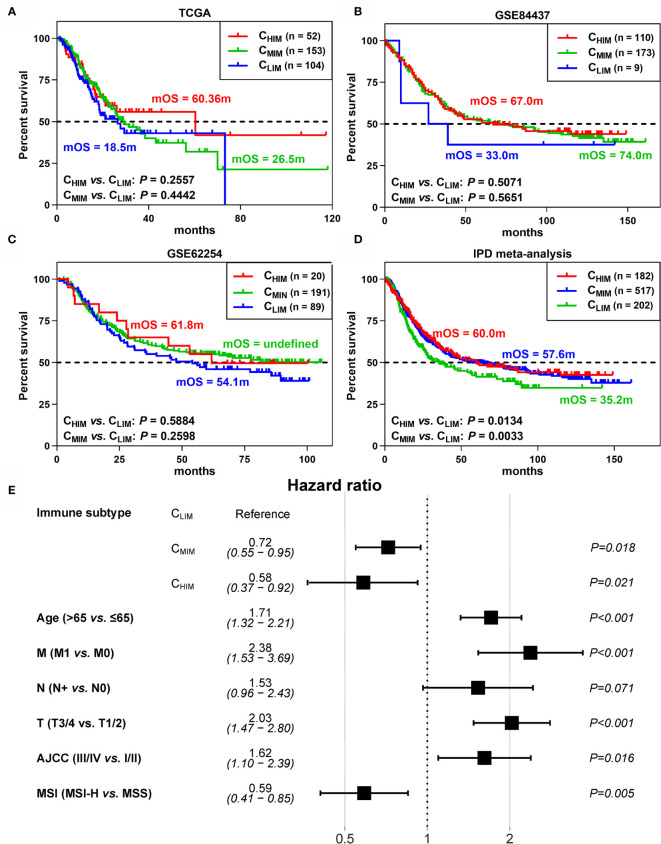
Figure 3.
Differences in survival between immune subtypes. (A–C) Kaplan-Meier curves of survival data in patients of 3 subgroups from TCGA (A), GSE62254 (B), and GSE84437 (C) datasets. (D) Kaplan-Meier curves of survival data in the combined cohort by individual patient data (IPD) meta-analysis. (E) Hazard ratios of clinical factors by multivariable COX regression.

