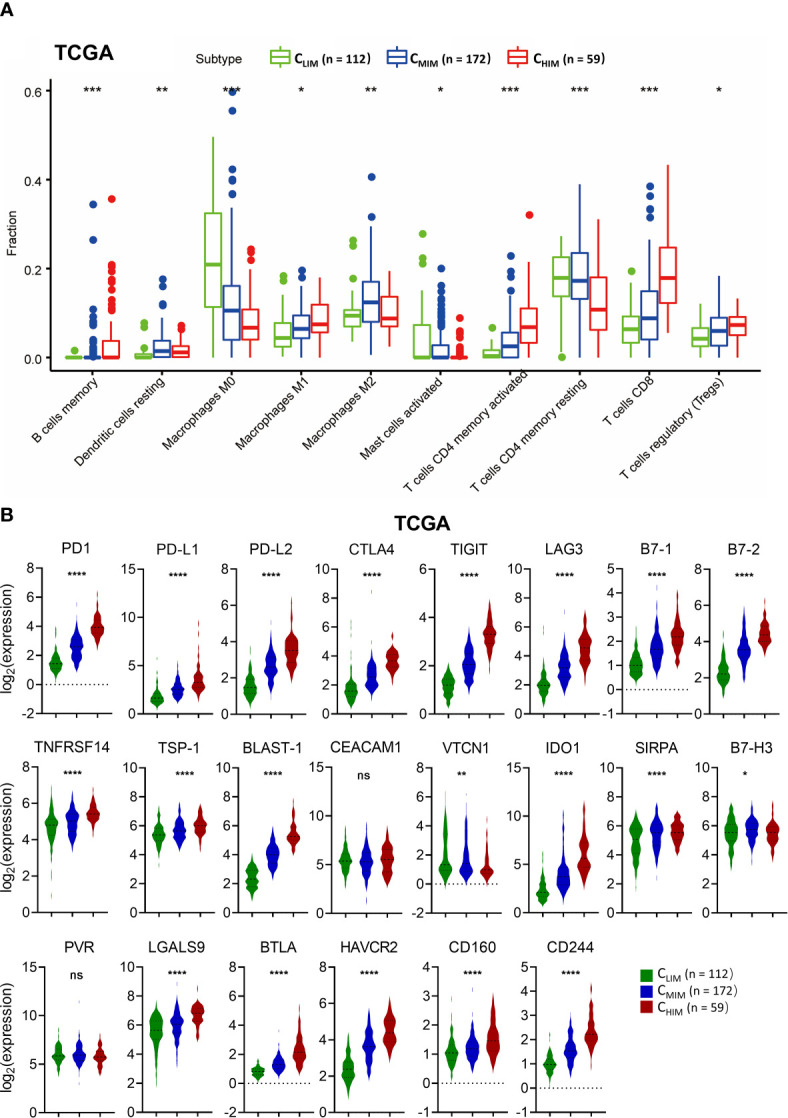
Figure 5.

Comparison of immune cell infiltration and immune checkpoint molecule levels in different immune subtypes. (A) Fractions of tumor-infiltrated immune cells in three immune subtypes in the TCGA cohort. Only cells with significant differences among the subtypes are shown. (B) Levels of co-inhibitory molecules in three immune subtypes in the TCGA cohort. ns not significant, *P < 0.05, **P < 0.01, ***P < 0.001, ****P < 0.0001.
