
FIG 4.
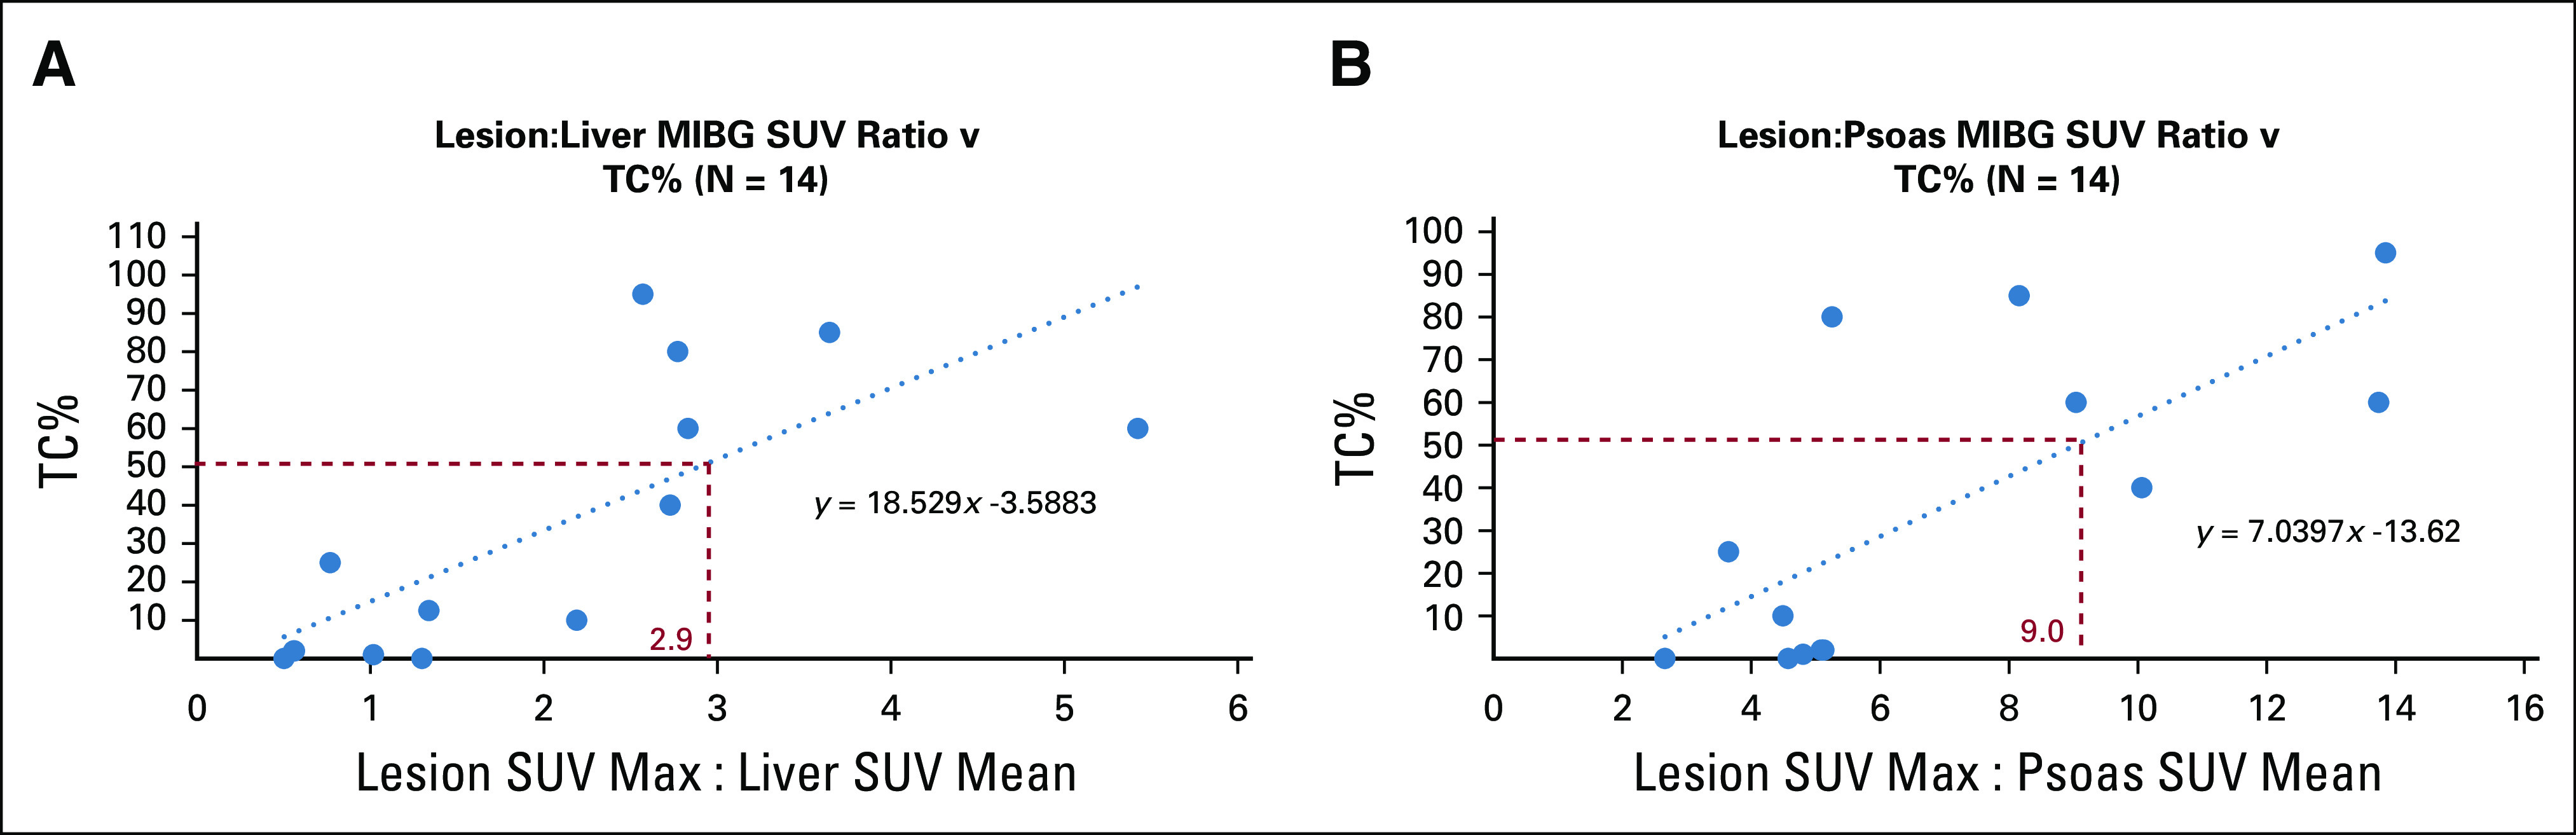
(A) Linear regression analysis demonstrating the relation between the ratio lesion maximum SUV and right lobe of liver mean SUV and lesion TC%. The red dotted lines mark the SUV ratio corresponding to a TC% of 50%, assuming a linear relationship. (B) Linear regression analysis demonstrating the relation between the ratio lesion maximum SUV and right psoas mean SUV. The red dotted lines mark the SUV ratio corresponding to a TC% of 50%, assuming a linear relationship. MIBG, meta-iodobenzylguanidine; SUV, standard uptake value; TC%, tumor cell percent.