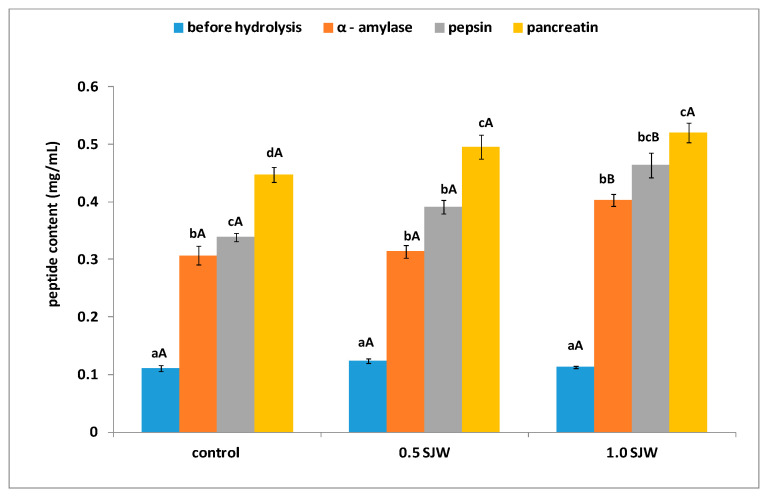
Figure 1.
Peptide content during in vitro hydrolysis. Control—cookies without St. John’s wort; 0.5 SJW—cookies enriched with 0.5% of St. John’s wort; 1.0 SJW—cookies enriched with 1% of St. John’s wort. All values are mean ± standard deviation for triplicate experiments. Different capital letters at the same enzyme indicate significant differences for the same indicator (α = 0.05). Different lowercase letters in the same samples indicate significant differences for the same indicator (α = 0.05).

